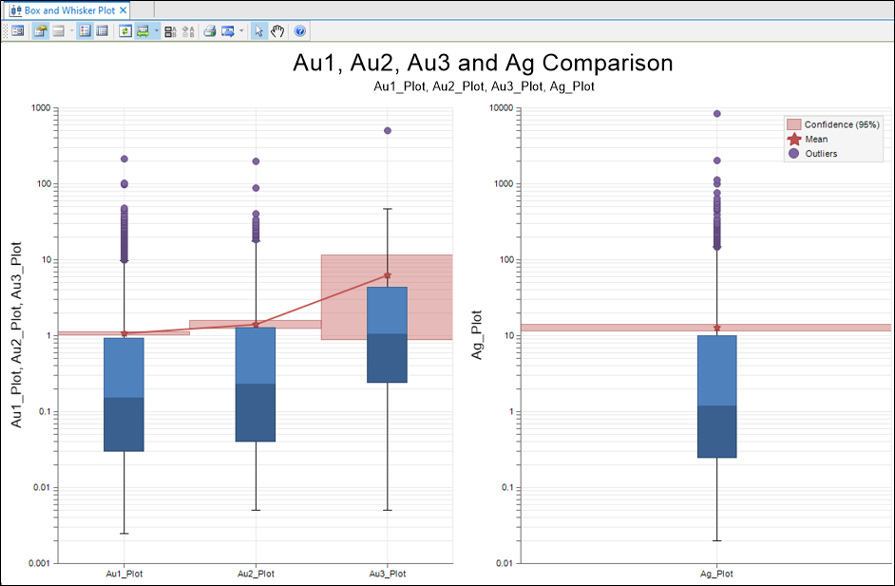
Box and Whisker
![]()
To prepare data for a Box-and-Whisker plot (for example to compare RC with diamond assays, or composites with a block model), create separate fields for each group of data:
- For data that is already in one file, create new fields (e.g. RC_Assay and DDH_Assay) and then use the file calculator (with a filter enabled) to copy the grades into the corresponding fields.
- For data in separate files (e.g. drillhole composites and block model) create a new file with the necessary fields and then append data from the source files to the new target file, via the Merge | Micromine function (on the File tab, in the Import group).
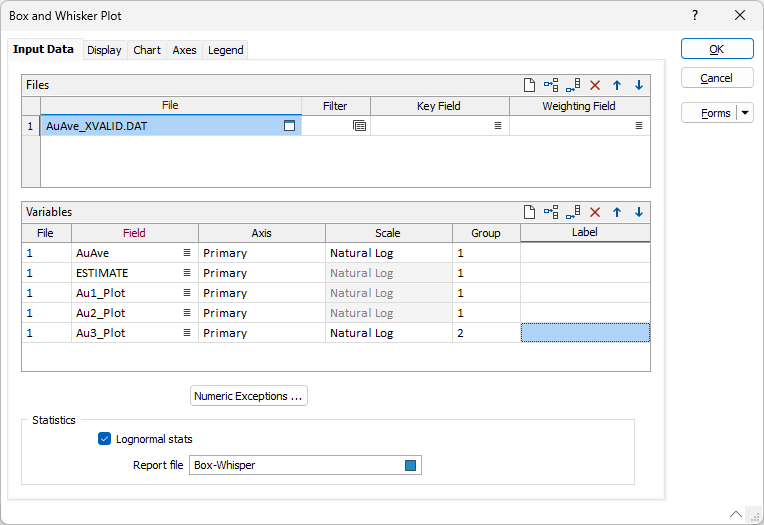
Input Data
Files
On each row of the grid, double-click (or click on the Select icon) to select the name of the files containing the source values. If required, define a filter to selectively control which records to process in each file.
Key field
For each input file, optionally select a Key field (for example, a field that contains lithology codes or horizons) to create a plot for the unique values in that field. The plot names are formatted using the field name and each key value.
Note: A maximum of 200 domains can be selected, to ensure clarity of display on a standard 1920 x 1200 screen.
Weighting field
For each input file, optionally select a Weighting field. When a Weighting field is applied, weighted means, standard deviations, confidence intervals and variances will be written to the report file. If no Weighting field is specified, un-weighted values will be written to the report file.
Numeric Exceptions
(Optionally) Use the Numeric Exceptions group to control the way that non-numeric values are handled. Non-numeric values include characters, blanks, and values preceded by a less than sign (<).
Variables
Field
Double-click (or click on the Select icon) to select the name of the fields that will be plotted along the X axis.
You can use the mouse with the SHIFT or CTRL key to multi-select the fields. This will add multiple rows to the grid simultaneously, for each selected field.
Note The fields you multi-select may overwrite existing row/field selections. The safest way is to append a row to the list before multi-selecting fields.
Use the buttons on the local toolbar to Manage the rows in the list.
Axis
Choose whether to display each field on the Primary or the Secondary axis.
Note that default labels in charts often use the input field name to label the data being plotted. If these fields are expressions, then the expressions will be used as the label text. To avoid this, you can use an additional attribute to define the label. See: Output Field Name Attributes
Scale
Select a LINEAR or NATURAL LOG scale for the Y axis.
Group
Box-and-Whisker charts can be divided into any number of groups, which are ideal when summarising fields that are unrelated or have substantially different ranges or probability distributions. To use the Group column, simply allocate the same number to each field belonging to a given group.
Label
Optionally, specify a label for each variable in the list. If a label is blank, the field name will be used.
By default, the fields (and labels, if any) that are assigned to an axis are included as a comma-separated list in the Chart title.
To create vertical labels, you can set the angle of the text to 90 degrees in the advanced axes options.
Statistics
Log-normal statistics
Log-normal box plots will only show log-normal stats if the check box is selected. This option is enabled when the Scale is set to NATURAL LOG.
Report File
Enter (double-click or click on the Select icon) to select the name of the Report File that will be written as a result of the process. To see the contents of the file, right-click in the file box and select View (F8).
OK
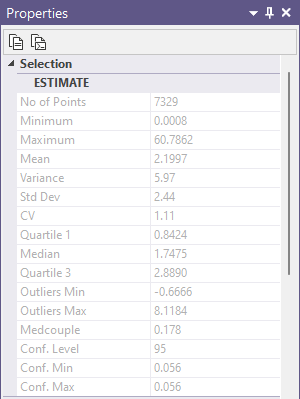
When you have set Display and Chart options, click OK to generate the plot. Various statistics are calculated and displayed in a Properties pane to the right of the plot.
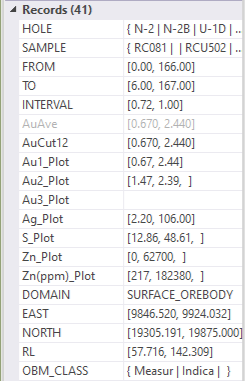
Summary statistics for the selected box are also shown in the Records section of the Properties pane:
|
|