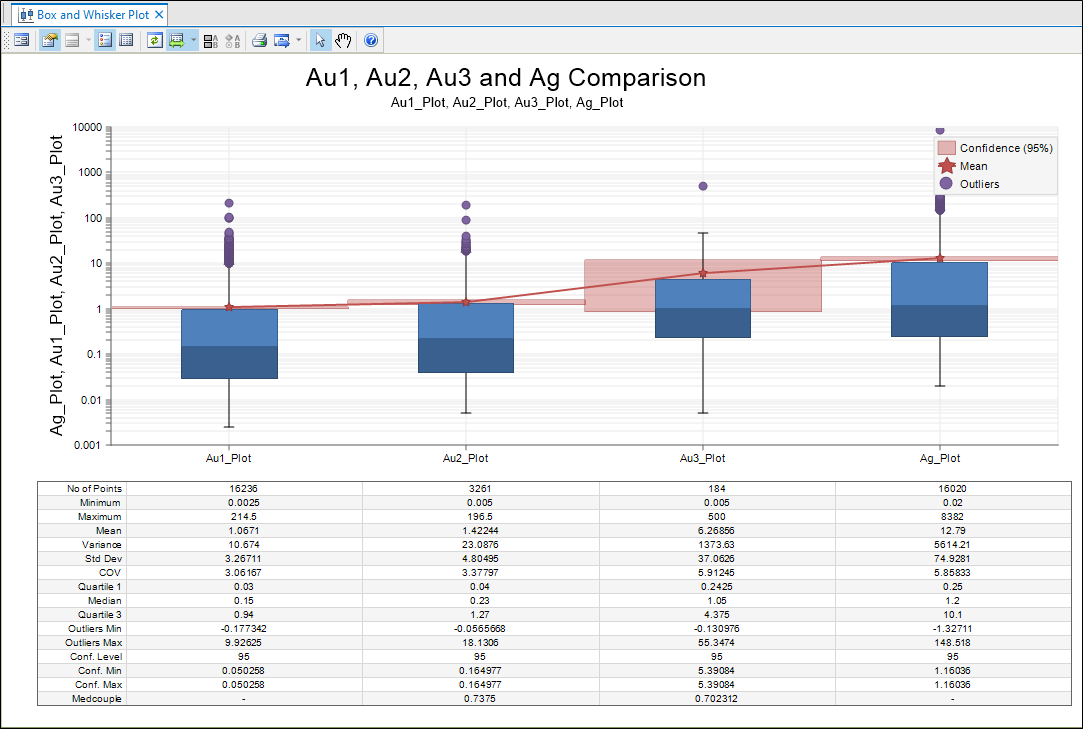
Display
On the Display tab of the Box and Whisker Plot form, set the colours for the upper and lower boxes and choose whether to display outliers, the mean, and confidence bands.
Boxes
Upper and Lower Colours
Double-click to select the colour that will be used for the upper and lower bounds of the quartile boxes.
Colour by key
If a Key field has been specified on the Input tab of the form, select this option to colour-code the values on the plot by Key field value.
Sort
If a Key field has been specified on the Input tab of the form, you can choose to sort the data by Key field value, or sort using the Field order specified on the Input tab.
Double-click on the icon to select a palette. If you do not select a palette, a default palette is applied.
Outliers
The application uses the whiskers to identify outlying values whenever the Outliers option is enabled:
- When the boxplot is in Linear mode the whiskers represent 1.5 × the interquartile range (IQR)
- When the boxplot is in Natural Log mode, the whiskers represent the calculated medcouples, as described in Hubert & Vandervieren (2008), An Adjusted Boxplot for Skewed Distributions, in Computational statistics & data analysis 52.12 (2008): 5186-5201).
When  , all observations outside the interval...

will be marked as potential outliers. For  , the interval becomes:

When the Outliers option is disabled:
- The whiskers are at the minimum and maximum data values
Colour
Double-click to select a colour that will be used for the outlier points.
Marker
Select a marker symbol for the outliers. A range of standard (Circle, Square, Diamond, Pentagon, Hexagon, Star, Triangle, Plus, Cross) marker symbols are available for selection in a drop-down list.
Transparency
Use the Transparency slider to specify the transparency of the outliers in the plot display.

Mean
Select this check box to show the mean on the quartile boxes. If a Natural Log axis has been selected, the geometric mean is calculated.
Show drift
Select this check box to show drift lines between the means for each field.
Colour
Double-click to select a colour that will be used for the drift lines and the mean symbols.
Marker
Select a marker symbol for the means. A range of standard (Circle, Square, Diamond, Pentagon, Hexagon, Star, Triangle, Plus, Cross) marker symbols are available for selection in a drop-down list.
Display Confidence Bands
Select this check box to display confidence bands in the output.
Colour
Double-click to select a colour that will be used for the bands.
Confidence
Enter a Confidence value. This is a percentage value which determines the range of sample means that will include the true mean.
For example, to be 90% confident, we estimate that the sample mean is somewhere in the middle 90% of the distribution of the sample means.
Display per-box statistics
Select this option to display summary statistics for each of the variables you have specified in the grid list. The precision is taken from the precision of the data fields in the input file.
Note that this does not affect the precision of stats which are not in the same scale as the data, such as COV and Confidence, etc. The values in those field values are formatted using significant figures.
Show "ALL" box plot(s)
The Show "ALL" box plot(s), when selected, will add an "ALL" key to each field, which will use the data in all key bins for each field.
Append file name to box labels
When multiple input files are specified, select this option to append each file name to the box labels using a field@file name notation.
