Numeric Line Sets
There is no undo facility when you edit colour sets, hatch sets, line sets, or symbol sets. If you want to be able to undo any future changes or deletions, you should first use the Save As button to save your current settings as a form set which can be re-loaded.
To define a Numeric line set:
- On the Home tab, in the Symbology group, open the Numeric Line Sets form.
You can also open the Numeric Line Sets form by right-clicking (F4) in the Line Set response in a form (when the Line field you have selected is a numeric field).
- Decide on the number of ranges (bins) into which
you will divide the data and then enter values that define the limit of
each range in the Value column. The ranges you define will appear in the
Label column. The contents of the Label
column can be used in the legend frame of a plot.
If the Auto update labels check box is selected, labels are automatically generated, based upon the entries in the Value column.
You can modify the labels if you wish. To keep your modifications when there is a subsequent change to an entry in the Value column, deselect the Update labels check box.
- Alternatively, use the Calculate and Assign buttons to divide your data into suitable ranges.
- Select a Line Sets for each range.
- If necessary you can modify the labels that are generated automatically based upon the values entered. Use the buttons on the local toolbar to Manage the rows in the list.
- Click Save As to save your changes as a new form set. Click Save and Close to save the current form as the default form set and close the Edit Line Sets form.
Numeric Line Grid
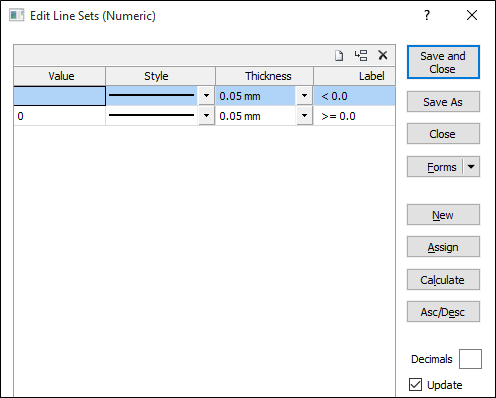
Value
Decide on the number of ranges (bins) into which you will divide the data and then enter values that define the limit of each range in the Value column.
Style and Thickness
Select the (SOLID, DASH, DOT etc) line Style and the (THIN, MEDIUM, THICK, or custom) line Thickness that will be used to represent each range.
Label
If the Auto update labels check box is selected, labels are automatically generated, based
upon the entries in the Value column.
You can modify the labels if you wish. To keep your modifications when there is a subsequent change to an entry in the Value column, deselect the Update labels check box.
Decimals
In the Input box at the lower right of the form, enter the number of Decimals to be used when labelling values.
Forms
Click the Forms button to select and open a saved form set, or if a form set has been loaded, save the current form set.
New
Click the New button to clear all of the response boxes in the form.
Assign
Click this button to automatically calculate ranges. Enter the number of ranges and choose a calculation method. Assign will use the Min and Max values in the file as the limits.
Calculate
Click this button to automatically Calculate ranges based on first and last values (you enter) and either a set number of intervals or a set interval size.
Asc/Desc
Click this button to reverse the order of the ranges as Ascending or Descending. This is useful when you have a preference for the order in which the values will appear in a plot legend. Values occurring on a range border will take the colour, hatch, or line defined for the first range.
Save As
Click Save As to save your changes as a new form set. See: Save As
Save and Close
Click Save and Close to save your changes as the default form set and close the form.
Cancel
Click the Cancel button to close the form without saving your changes. Note that the Edit form will always show the last changes that were made. To revert back to where you were before changes were made, you will need to re-load a saved form set. If your original settings were not saved as a form set, they cannot be recovered.