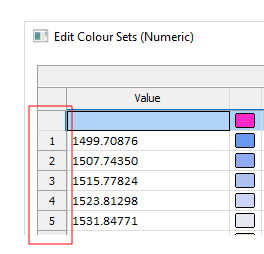
Numeric Sets
Numeric colour sets, hatch sets, line sets and symbol sets are used to allocate colours, hatches, lines, and symbols to data divided into numeric ranges. Numeric sets are associated with numeric data fields such as those containing assay values.
To create a numeric set, you divide your data into a series of ranges (bins) and allocate a colour, hatch, line, or symbol to each. You can also use Assign and Calculate functions to simplify this task.
In the Numeric Colour Sets form, a row number column (the left-most column in the grid list) makes it easier to determine the number of ranges in a set. The first and last row numbers in each list are left blank because they represent open-ended ranges that do not apply to the Assign process.
Normal Limits
Graph minimum and maximum
Enter the minimum and maximum values that will be shown on the graph. If the Graph Mode is set to NATURAL LOG (Ln), the minimum value must be greater than 0. If you use the short cut method (left double-click or F3) to obtain the maximum value, it will be adjusted to ensure there is an integer number of bins.
End first bin
Enter a numeric value to define the end of the first bin (data range) on the display. Your entry should be based on knowledge of the input data set.
Due to problems with detection limits or with highly skewed distributions, a very large number of values may end up in the first bin on the display. By defining the value for the end of the first bin separately from the boundaries for subsequent bins (data ranges), you can ensure the graph is not distorted.
As a guide to the location of the end of the first bin you can use a value of (Mean - (3 x SD)). Where SD is the standard deviation of the data set.
Bin size
Bin size defines the interval between successive increments on the graph. If, for example, the bin size is set to 0.1, (with the first bin ending at 0.05) the boundaries will be at 0.15, 0.25, 0.35 and so on.
Choose the Bin size so that it maximises the significance of the data. Too large a bin size will result in few bins with very large differences between them. Too small a Bin size will result in bins not being adequately represented (under sampled) giving a “spiky” looking histogram.
As a guide, the histogram should have bins equal to about (0.25 x SD). Where SD is the standard deviation of the data set.
Up to 500 bins may be defined for a histogram.
Graph increment
Enter the interval between values along the X axis of histograms and cumulative frequency curves, or the Y axis of probability plots. Ticks and labels will be positioned along the axis at this interval.
When in NATURAL LOG (Ln) mode, the values shown on the axes may all be grouped at one end unless Apply to Ln values is selected.
Changing labels
If the Update labels check box is selected, labels are automatically generated, based upon the entries in the Value column. These labels have the following standard forms: nn.nn to mm.mm, <=nn.nn , =>mm.mm.
Changing the label order
When you want to change the range order from ascending to descending, click the Asc/Desc button. This allows you to reverse the order in which the colour ranges will appear in the legend on a plot.