Modelling Process
In a three-dimensional setting, determining the directions of continuity is a three-step process:
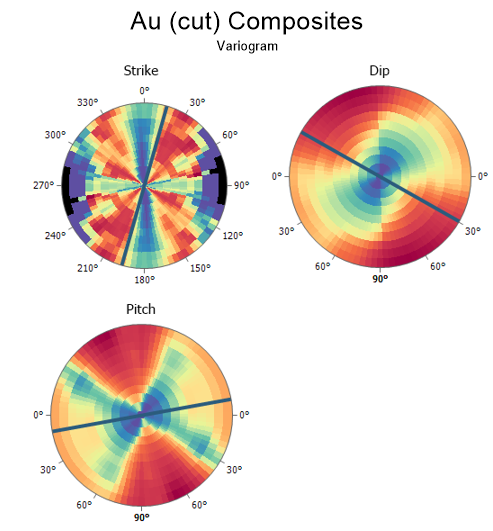
- Create a horizontal variogram map:
- Use Add Direction to measure the direction of greatest continuity, which defines the strike of the plane containing it.
- Click on the next map.
- Create a vertical variogram map at 90° to strike:
- Use Add Direction to measure the direction of greatest continuity, which defines the dip of the plane containing it.
- Click on the next map.
- Create an inclined variogram map in the strike/dip plane:
- Use Add Direction to measure the direction of greatest continuity, which defines the pitch (rake) of the main direction falling within the plane defined by the strike and dip.
- Click to apply the third orientation.
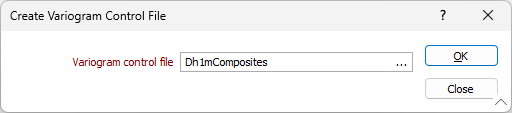
- Click New Control File to generate an axis summary to be used as input in the semi-variogram (Variograms) and search ellipsoid (via Vizex | Search Ellipsoid) forms.
Note only one direction can exist on each map of the Summary View.
If necessary you can click on the previous map to return to it. Only the horizontal variogram map is required in a two-dimensional setting.
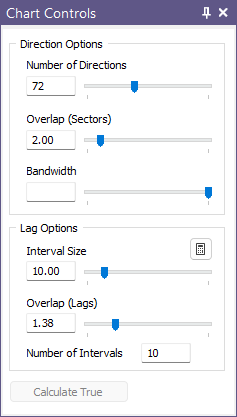
Interactive sliders in the Chart Controls pane may be used at each step in the modelling process to adjust and refine the map parameters, with an instant preview of the result. Clicking Calculate True will recalculate the true map using the new parameters, which may cause a small change in appearance.
The application displays reference tics around the perimeter of the map to help keep it in context:
- In the horizontal map they show azimuth
- In the dip map they show dip; the forward and reverse dip directions are also shown
- In the inclined map they show pitch; the forward and reverse strikes are also shown
For reference the status bar always displays the azimuth and plunge of the mouse pointer’s position.
Right-clicking an existing variogram control file (via New Variogram Control File) will display a full report showing the calculated orientation in all possible conventions (rotations, azimuth/plunge, and strike/dip/pitch).
When you generate a chart, many of the tools and options on the Chart ribbon are common to most charts. See: Chart Tools
On the Chart | Variogram Map tab, in the Variogram Map group, you can:
- Click Add Direction to pick one or more directions.
![]()
- Click Change Direction to move the selected direction.
![]()
- Click Delete All Directions to remove all displayed directions.
![]()
- Click Delete Selected Direction to remove only the selected direction.
![]()
- Click Measure to measure the anisotropy ratio (the ratio of the semi-major and semi-minor axes) by measuring their radii.
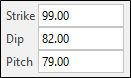
- Set Strike, Dip and Pitch values to change the orientation of the variogram maps.
![]()
-
Click Summary View to view maps for Strike, Dip and Pitch all together, as an alternative to navigating each view.
Micromine Origin & Beyond will always open the Semi Variogram Map in Summary view. You can double-click on one of the maps to quickly switch to that individual (Strike, Dip, or Pitch) view.
You can use the button on the ribbon to return to Summary View, but it will not be enabled if the three angles are not defined.

-
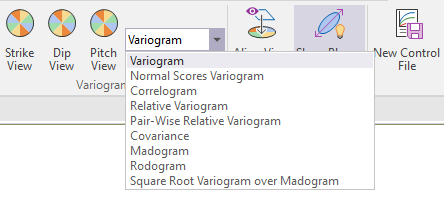
Select a Variogram type type to recalculate the variogram maps without going back to the form:
- Click the Align Vizex View button to orient the Vizex screen plane so it is parallel to the current map.
![]()
- Click the Show Planes in Vizex button to display a 2D ellipse showing the current variogram direction in Vizex. See: Show Planes in Vizex.
![]()
- Click the Experimental Variogram button to show or hide an experimental variogram graph alongside the variogram map. See: Preview Selected Direction
![]()
- Click the Variance button to show or hide the variance value in the experimental variogram graph alongside the variogram map.
![]()
- Click New Control File button to save you settings to a file (one direction must be defined for 2D, and three directions must be defined for 3D).
![]()
If you select an existing file, you will be prompted to overwrite or cancel.
To view the contents of the file you have created or selected, right-click in the Variogram control file response.
- Click the Show Control File button to select and open an existing file. See: Show Control File
![]()
- Click the Properties button to show or hide the Properties panel alongside the variogram map.

![]()
- Click the Chart Control button to show or hide the Chart Controls panel alongside the variogram map.
![]()
- Click the Chart Help button to open the Variogram Map help chapter online in your default Internet browser.
![]()