Variogram Map
![]()
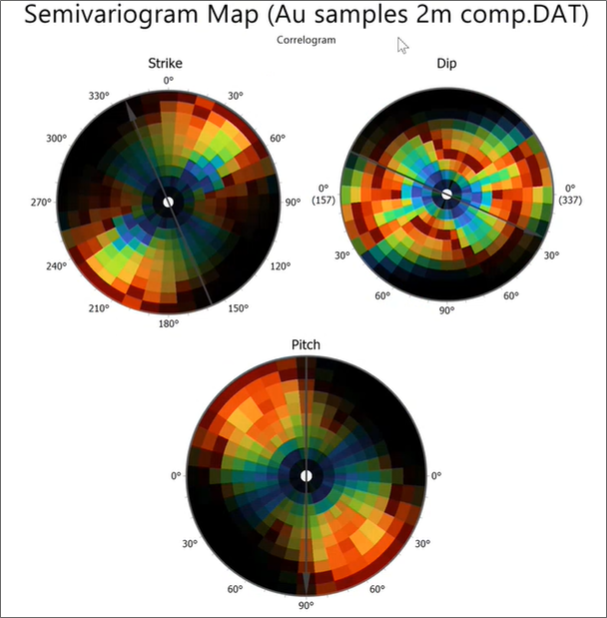
The function uses a three-stage workflow to define the strike and dip of the plane containing Axes 1 and 2 (of the data), and then measure the pitch of Axis 1 in that plane (the direction of greatest continuity). Once that is done, all of the other orientations (rotations, azimuth/plunge, etc.) are derived when needed.
See: Variogram Map
Input Data
The upper half of the Semi Variogram Map form relates to the input data, any transformations, and the map display. Processing Options are available for selection on the lower half of the Semi Variogram Map form.
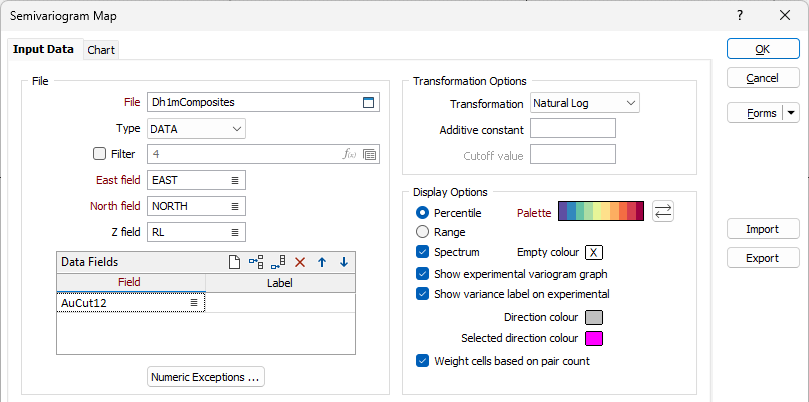
File
Select a file type and then double-click (or click on the select icon) to select the name and type of the File containing the raw data and specify the field from which the semi variogram will be calculated.
Filter
Select the Filter check box if you want to apply a filter to the data in the file. Enter a filter number in the adjacent response. Double click (F3) to see a list of existing filters. Right click (F4) to open the dialog box to create a new filter or edit an existing filter.
East, North, Z fields
Double-click (or click on the select icon) to select the fields that contain Easting, Northing and (optional) Z coordinates.
Data fields
Select the fields in the input file on which the semi variograms will be based. Optionally, specify a label for each field. Use the buttons on the local toolbar to Manage the rows in the list.
Numeric Exceptions
(Optionally) Use the Numeric Exceptions group to control the way that non-numeric values are handled. Non-numeric values include characters, blanks, and values preceded by a less than sign (<).
Transformation Options
Transformation
If you need to transform the data in the analysis field before the calculation, choose the appropriate transformation and enter the related parameters.
Aside from not altering the data at all, the most commonly-used transformations are NATURAL LOG and INDICATOR. See: Transformation
Additive constant
This input will be enabled if you have set Transformation to NATURAL LOG.
An additive constant can be used with a natural log transformation to force data which is near log normal to take on a log normal distribution. Since the additive constant is added to all values, it has the effect of increasing the Natural log of small values relatively more than large values; in effect rotating the graph of the natural logs of the data value to the right.
Cutoff value
This input will be enabled if you have set Transformation to INDICATOR.
Specify an indicator cutoff value. Values below the cutoff value will be changed to 0, and values above will be changed to 1, and the calculation will use the zeroes and ones instead of the original values.
![]()
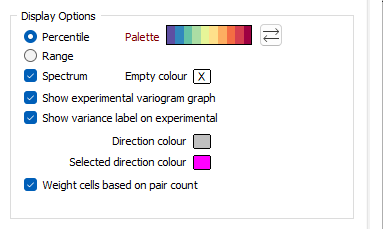
Display Options
Palette
Double-click on the Palette box to choose a palette. You can also right-click on the box to see a preview of the current palette.
Empty colour
Double click (F3) to select the colour which will be used to denote NULL or empty cells.
Range or Spectrum
Percentile is the default display option. Select Range to apply the colours in the chosen palette to each range. Select Spectrum to subdivide each percentile or range into eight equal parts, each with its own interpolated (or ramped) colour. This ensures that the colour coding is applied much more smoothly in the map.
Show experimental variogram graph
Select this check box to enable the experimental graph for the variogram.
Show variance label on experimental
This check box, when selected, indicates that the variance label will be displayed on the experimental graph.
Direction colour
Double click (F3) to select the colour which will be used to denote direction cells.
Primary direction colour
Double click (F3) to select the colour which will be used to denote the primary direction cells.
Weight cells based on pair count
This option, when selected, indicates that each cell will be weighted by the count of pairs that contribute to it, and fade to the colour set for the Empty colour option as the count approaches zero.
Where there are less pairs, the greater the transparency. So if the empty colour is set to black, for example, the variogram maps will provide a clearer sense of where there is no data:
Processing Options
Processing Options are available for selection on the lower half of the Semi Variogram Map form.
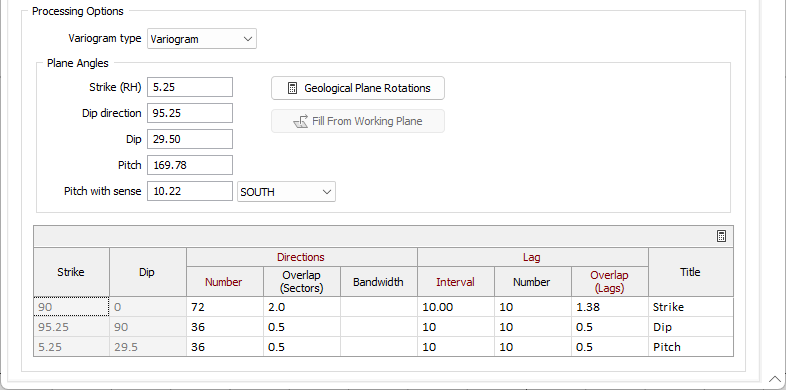
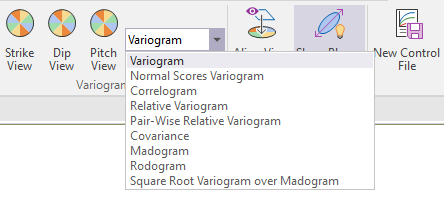
Variogram Type
Select an input variogram type:
| Type | Description |
|---|---|
| Variogram | A semi variogram (often abbreviated to variogram) is a graph of the average value differences (and thus the correlation) between sample pairs at different distances. |
| Normal Scores Variogram | A Normal Scores variogram is used directly in Gaussian techniques and can also be transformed to correctly represent the variogram of original units. |
| Correlogram | Displays the inverse of the spatial correlation of the lagged data. |
| Relative Variogram | Scales the variogram by a function of the lag mean. |
| Pair-Wise Relative Variogram | A Pair-wise relative semi variogram may be used to model data that exhibits clustering and a strong positive skew. It reduces the influence of high values in the computation of the variogram, improving the interpretability of the graph. |
| Covariance | Displays the spatial covariance of the lagged data. |
| Madogram | (First Order Variogram): Displays the absolute values of the lagged data. |
| Rodogram | (Half order variogram): Displays the square roots of the lagged data. |
| Square Root Variogram over Madogram | Displays the square root of the Variogram over the Madogram. This is useful for validating a Gaussian Anamorphosis. |
Note: The smoothness of the Madogram and Rodogram make them useful for determining the range and anisotropy of noisy data. Do not use them for interpolation.
You can also change the variogram type and quickly recalculate the variograms while the chart is open:
Plane Angles
In the Plane Angles group, set the orientation of the map plane. The simplest way to do this is to set initial Strike, Dip Direction, Dip, Pitch and Sense orientation parameters.
Geological Plane Rotations
Click this button to view or edit the parameters used to set the orientation of the map plane. See: Geological Plane Rotations
Fill From Working Plane
This button can be used to quickly set the orientation of the map plane to match the current Vizex Working Plane (the button is disabled if there is no working plane defined). See Align View to Working Plane
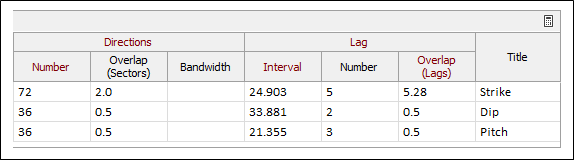
In the Processing Options grid, Strike and Dip information is displayed. Here you can enter the Directions and Lag information for the Semi Variogram Map.
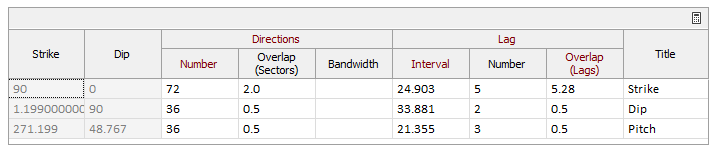
Note that the Processing options are in True mode, so all included rows of the grid require a Number value. The Auto calculate grid button will determine the Lag values for the selected row. ![]()
Directions
Number
The number of angular increments needed to define the full 360° circle of the map. For example, setting this to 72 will produce 5° increments (360 ÷ 72).
Overlap (Sectors)
Enlarges the pairing neighbourhood of the current sector by adding that number of sectors either side of it. For example, setting this to 1.5 will pair all points falling within 1.5 sectors either side of the current sector. Increase this value whenever there appears to be directional noise in the map.
Bandwidth
Optionally limits the width of the search sectors. For example setting this to 10 will prevent the sector search becoming any wider than 10 grid units (metres or feet) either side of the current direction.
Lag
Interval
The Lag Interval is the step size used to define radial distances on the map. For example, setting this to 25 will produce sectors at radial distances in 25 (grid unit) increments. This number should be close to the average sample spacing.
Number
The number of lags in the map. Together with the interval this defines the total radius of the map. For example, setting this to 15 with a lag interval of 25 will produce a map with a radius of 375 (grid units). This radius should be about one-half of the diagonal distance through the area under investigation. Reduce the number of lags if you see gaps around the outer edge.
Since the variogram map workflow is an interactive three-step process in which the lag interval and the number of lags for the second and third maps are determined after the direction on the preceding map has been measured, the Auto Calculate Grid button will only set initial values for the first row.
It is normal to reuse the parameters from the previous map when advancing to the next, only adjusting the values of the next map if the values of the previous map are inappropriate.
Interval and Number of Intervals parameters for the second and third rows can (optionally) be auto-calculated in the second and third map displays, using the Lag Options group of the Chart Controls dialog:
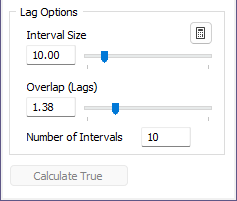
These parameters are then written back to the Processing Options grid.
Overlap (Lags)
Enlarges the pairing neighbourhood of the current lag by adding that number of lags in front of and behind it. For example, setting this to 2 will pair all points falling within 2 lags either side of the current lag. Increase this value when there appears to be radial noise in the map.
Title
Use the Title field to enter a name for the direction label.
Forms
Click the Forms button to select and open a saved form set, or if a form set has been loaded, save the current form set.
By design, the Forms button is not available for loaded Vizex layers (i.e. when opening the form set properties of a layer in the Vizex Layer Display pane). In Vizex, the Forms button is only available for new forms opened via the Home tab or the Vizex tab, in the Layer group (or by double-clicking on a form type node in the Vizex Layer Types pane).
Save and Save As
Click the Save button to save the changes you have made to the form set. Click Save As to save your changes as a new form set. Save As will default to the first available form set number.
Reset
Click Reset to clear the form of all values and reset the form to its default state.
Reset Tab
For tabbed forms, select Reset Tab to clear the active tab of all values and reset the tab to its default state - without making any changes to other tabs in the dialog.
Undo and Redo
Click Undo (CTRL + Z) to undo recent changes in the form. After an Undo, click Redo (CTRL + Y) to restore the last change that was undone.
Collapse
Collapse (roll-up) the form to preview a chart, or preview the results of an operation in Vizex, or obtain input values from Vizex, the Property Window, the File Editor, or the Plot Editor.
OK
Finally, click OK to generate the semi variogram map.