Chart | Scattergrams
When you run the regression, the data from the X and Y axis fields are displayed in a Scattergram Chart. Information about the chart is also shown in the Properties Pane.
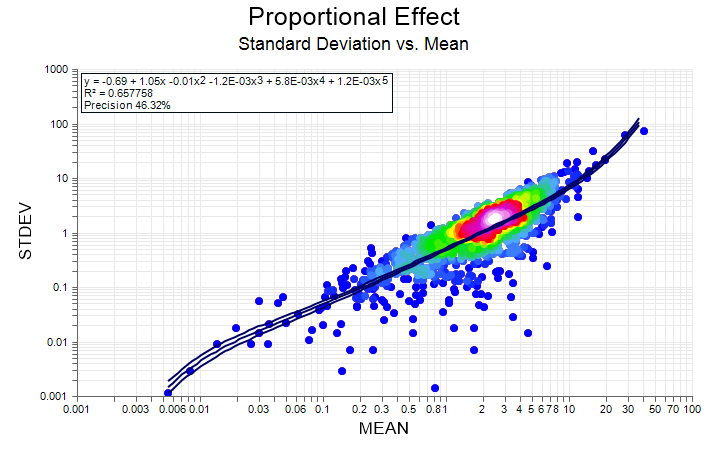
An information summary may also be displayed on the chart itself. This information includes:
- Statistics for each variable such as the mean and standard deviation.
- The coefficients for the equation y = a + bx.
- A correlation coefficient.
- The ratio of the X and Y variances.
When you generate a chart, many of the tools and options on the Chart ribbon are common to most charts. See: Chart Tools
Other tools on the Chart tab are specific to the type of chart displayed. In the Scattergram display:
-
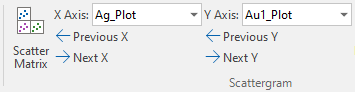
Click this button to toggle between showing individual charts in sequence or showing all charts on the same canvas in Scatter Matrix mode. In Scatter Matrix mode, you can also double-click on a graph to expand it (and exit Scatter Matrix mode).

In Single chart mode, the following options are available:
-
Select the field that will be displayed on the X axis.
-
View the previous group of samples on the X axis (Left key)
-
View the next group of samples on the X axis (Right key)
-
Select the field that will be displayed on the Y axis
-
View the previous group of samples on the Y axis (Left key)
-
View the next group of samples on the Y axis (Right key)
Whenever you create a report file in a multiple regression (where there is more than one X-axis field), interactively changing the X- or Y-axis field names will append the new combination to the report. This facility provides a way to quickly accumulate the reports corresponding to each X/Y field combination. However, the Report file will grow very quickly, so you should avoid using a Report file until you have finished exploring your data.
-
Click this button to Show (or Hide) univariate frequency charts:

-
Click Show Line to toggle the display of the Regression line on and off:

-
Click Show Equation to toggle the display of the Regression equation on and off:
