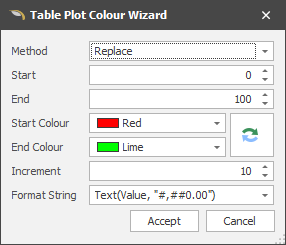
Colour Wizard
Use the Colour Wizard to automatically create colour ranges for your Table Plot. If no colours are chosen the resulting Table Plot will be white.
Method
Choose whether to Append to or Replace the intervals currently defined in the legend.
Start and End
Specify Start and End values to define a data range.
Start Colour and End Colour
Choose the colours that will be used to generate a colour range. Click the reversal icon (at the right of the Colour inputs) to switch between Start Colour and End Colour:

Increment
Specify an increment to determine the number of intervals, based on the Start and End values you have entered.
Format String
Specify a formatting expression for the numbered intervals. Example: Text(Value, "#,##0.00%")
Accept
Finally, click Accept to apply your changes to the colour ranges (or click Cancel).
You can also set table plot colours by applying a Colour Palette.