Table Data
Select Table Data to view and manage mine site reserve data as a collection of Tables.
![]()
Tables are used to contain and manage mine site reserve information. Each table is a tree-oriented data structure whose purpose is to store and organise reserve data (e.g. Source and Destination) as well as calendars or any other data that could be considered Constant (i.e. does not change when running a mine schedule and/or haulage analysis).
Variable data is calculated or user-defined data which changes dynamically, for example, the quantity of coal moved in a month or the distance of a truck haul.
Examples of Constants:
-
Volumes
-
3D Solids
-
Centroids
-
Qualities
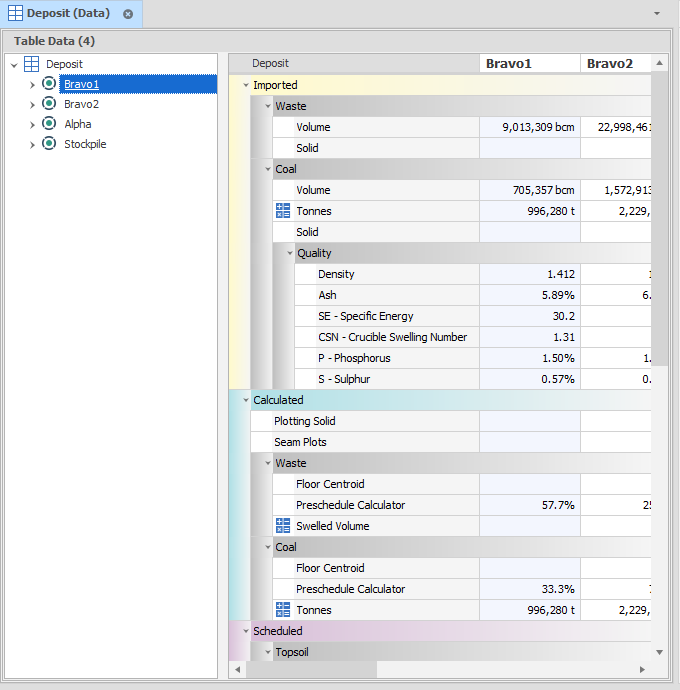
Double-click on a table to open the Table View:
Conceptually, Tables are similar – but not identical to – tables in Relational Database Management Systems (e.g. Microsoft Access, MySQL, SQLite). Where a RDBMS table stores data in rows, in Micromine Spry, rows are replaced with Nodes, which are organised into a user-defined tree structure. The branches of the tree are called Levels.
Levels
Tables require at least one Level and once you have imported data into the Table the number of Levels and the order in which they appear cannot be altered. You can however change the name of a Level when Data is present. To change the number of Levels or their Index, delete all of the Nodes from the Delete Nodes right-click menu.
Positions
Tables do not require Positions to be added before importing data but please note that the Index of the Positions is important later on so if you allow the Import Wizard to create your Positions you should always come back and check the order they appear in. Positions that are unused can be deleted when data is present but Positions that have Nodes cannot be deleted.
Fields
A Leaf is defined as the overall data container at the lowest Level in our Level/Position tree structure. Each of these Leaves can contain anywhere from one to a great many number of individual pieces of data, but each Leaf in a Table shares a common structure with the rest. This is needed because different types of data are stored in different ways (for example dates & percentages are stored and reported differently) and this structure is made up of Fields.
While each Leaf on a Table shares the same Fields, not every Field in a Leaf requires data. Example Fields include Waste Volumes, Initial State Percentages and Solids.
Solids
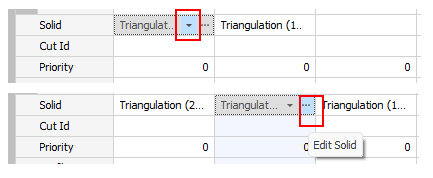
The solids associated with the full nodes or leaves of your table data can be previewed and edited via the Table View. Click the Triangulation drop-down of a Solid to see a Solid Preview. Click on the ellipsis button to open the Edit Solid window.
Tip: You can multi-select Fields and adjust shared properties (such as Aggregation) using the Ctrl/Shift buttons and the Properties window on the right.
![]() Any Field that is deleted when data is present will delete the data as well.
Any Field that is deleted when data is present will delete the data as well.
Ranges
Ranges allow you to filter your Table Data.
Editing Ranges: A good practice is to ensure that if you intend to change a Range to edit its intention, you should right-click and View References to ensure it isn't used elsewhere or alternatively create a new Range.
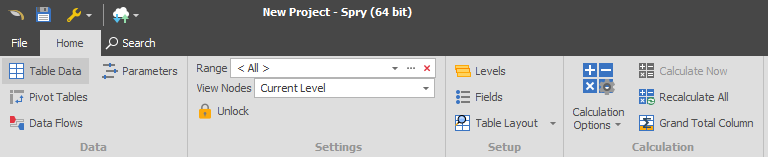
When a table is open, the ribbon is changed to show groups applicable to a data table. The layout and aggregation of the data is set in the Fields and Levels setup for the Table.
You can also choose to see only certain ranges of your data, which is covered in the Picked Range topic.
Deposit Table
For Source Scheduling: Every productive process has a value that is linked to a Field in the Deposit Table. Source scheduling is based on "working" this value, which is called the Source Quantity. Any Leaf in the Deposit Table that has a Source Quantity greater than zero can be worked. The most work that can be done on any Source Quantity is 100%.
Destination Table
In a simple conceptual sense, Destination Scheduling takes material from a Leaf in your Source Table and places it in a Leaf in your Destination Table. The amount of material moved is called the Destination Quantity and is not necessarily the same amount as the related Source Quantity.
Calendar Table
When you have parameters in your scheduling that are time-dependent (and there are more than a couple) then it may make sense to include a Calendar Table. Calendar Tables are commonly used to store Equipment rates and utilisation numbers. Each Scenario can have only one Calendar Table. For more information, see: Calendar Tables
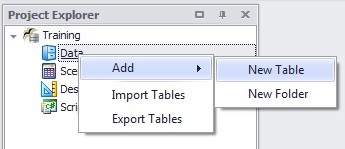
New Table
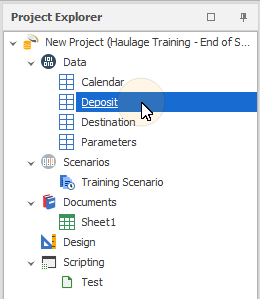
To create a new Table, right-click Data in the Project Explorer window and choose New Table. You can also sort your Tables into folders if you wish.
Regarding saving your work, although the application will save your project/model every time you run a Scenario, because we haven't yet created or run one, you should either hit Ctrl-S on your keyboard or left-click the Save icon at the top left of the screen intermittently as you build your model. There is also a Backup option for your model which will allow you to save a full (or light) version of your model as a different file.
To create a project/ model backup, right click the project name at the top of the Project Explorer tree and left-click Create Project Backup.
Default options (nothing selected on) will create a full backup of the model. Removing items from the database will reduce the size of the backup and may be requested by Micromine Spry Support to assist with model transfer (Solids and Triangulations take up a significant portion of most models).