Generate Plotting Polygons
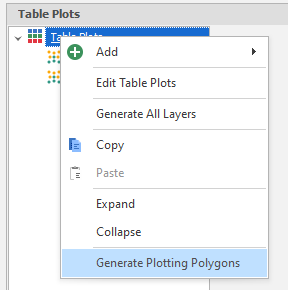
To generate Plotting Polygons, right-click the Table Plots icon in the Table Plots window.
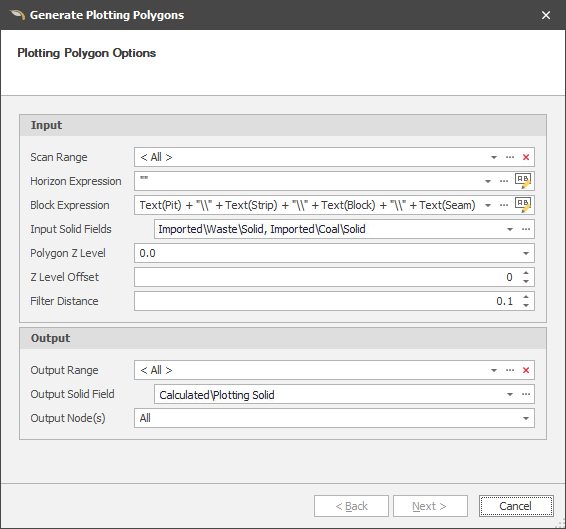
Before running this tool, ensure you have a new Solids Field to hold the generated polygons.
The general rule of thumb in using the Generate Plotting Polygons tool is that you use the same Grouping Expression that you use in your Table Plot. The Polygon Z Level will differ based on the requirements you have (commonly Maximum Z or 0.0 with an Offset).
Horizon Expressions
Specify an expression that defines horizons. The way the plotting polygons are generated is as follows:
-
Each node is put into its given horizon and block
-
Each horizon is evaluated individually, assuring that there is no overlap between blocks in that horizon. The block ordering is used to determine how overlaps should be resolved.
-
The result for each block in each horizon is stored in the specified output node.
-
This allows for table plots at different horizons to represent what the block looks like at that horizon. This is useful in cases where a blocks silhouette changes as you move from the top to the bottom, such as if you have an angle to your block.
Filter Distance
Specify the minimum distance between points in a generated polygon. The lower the filter distance, the more accurate the polygon will be. However, this may result in a higher point count and therefore more data to store.
Period Progress Plots
In combination with Post Schedule Tasks, you can use information from your previous Schedule runs to create Table Plots that show you where you have worked by date. See: Post Schedule Tasks
The recommended steps to create a Period Progress Plot are as follows:
- Create a Date/Time Type field in your Setup->Fields (inside a Post Schedule Task folder to ensure that it isn't overwriting anything important).
- Create a Post Schedule Task that writes Schedule Results back to the Source Node. Generally use either ScheduleMin or ScheduleMax and any other filters you might require.
- Create a Table Plot that references the new Post Schedule Task field you are writing to, as a starting point your Value Expression may look like: Year(NodesMin(GetValue(PostScheduleTasksDateStarted)))
- (Optional) Create a Post Schedule Task AFTER the Source Node one that recreates the Table Plot on each Schedule Run
Example
The example below can be pasted into the Table Plot area in the application. You will need to adjust the Grouping Expression, Solid Field, Value Expression and may want to re-run the Table Plot Colour Wizard.
Copy and paste into the application:
<TablePlot Name="Strip Ratio Plot" GroupingExpression="Text(Pit) + "\\" + Text(Strip) + "\\" + Text(Block)" ValueExpression="NodesSum(GetValue(ImportedWasteVolume))/NodesSum(GetValue(ImportedCoalTonnes))" TextFormatExpression="Text(Value, "#,##0.00")"><TextFontColour /><LegendFontColour /> <TablePlotColours> <TablePlotColour Description="Less than 1.00" Mode="LessThan" Value1="1" Value2="1"><Colour R="0" G="255" B="0" /></TablePlotColour> <TablePlotColour Description="Between 1.00 and 3.00" Mode="Between" Value1="1" Value2="3"><Colour R="85" G="255" B="0" /></TablePlotColour> <TablePlotColour Description="Between 3.00 and 5.00" Mode="Between" Value1="3" Value2="5"><Colour R="170" G="255" B="0" /></TablePlotColour> <TablePlotColour Description="Between 5.00 and 7.00" Mode="Between" Value1="5" Value2="7"><Colour R="255" G="255" B="0" /></TablePlotColour> <TablePlotColour Description="Between 7.00 and 9.00" Mode="Between" Value1="7" Value2="9"><Colour R="255" G="170" B="0" /></TablePlotColour> <TablePlotColour Description="Between 9.00 and 11.00" Mode="Between" Value1="9" Value2="11"><Colour R="255" G="85" B="0" /></TablePlotColour> <TablePlotColour Description="Greater than 11.00" Mode="GreaterThan" Value1="11" Value2="11"><Colour R="255" G="0" B="0" /></TablePlotColour> </TablePlotColours> </TablePlot>