Continuous Sampling
![]()
When you run the continuous sampling function, a Chi2 goodness of fit test is performed at the chosen significance level and the result is displayed. Depending on the degree of conformity between the sample data and the selected distribution, the fit will either be accepted or rejected. A message will appear stating the case.
You can also evaluate the test by comparing the calculated Chi2 value with the critical value. The distribution will be rejected if Chi2 is greater than the critical value. Insufficient sample data is a common reason why the fit may be rejected.
When the message “Degrees of Freedom < 1” appears, you will need to increase the number of bins before proceeding.
Source
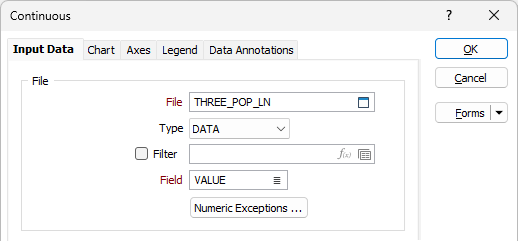
File
On the Input Data tab of the Continuous Sampling form, select a file type and then double-click (or click on the Select icon) to select the name of the file containing your data. You can optionally apply a filter to select a subset of the data in the file.
Field
Double-click (or click on the List icon) to select the Input field.
Numeric Exceptions
(Optionally) Use the Numeric Exceptions group to control the way that non-numeric values are handled. Non-numeric values include characters, blanks, and values preceded by a less than sign (<).
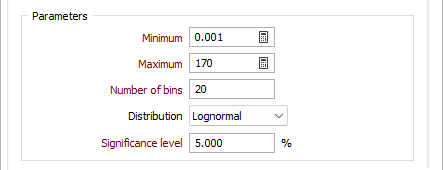
Parameters
Min and Max values
Enter the minimum and maximum values to be included in the analysis. One or both of these inputs may be disabled, depending on the distribution you have selected to test.
Number of bins
Enter the number of groups or subdivisions of data.
Distribution
Choose the distribution to test for Continuous sampling:
- NONE - Does not display an idealised distribution.
- UNIFORM - The distribution shows no central tendency; any value is as likely to occur as another.
- NORMAL - Distribution gives a bell shaped distribution curve caused by the symmetrical clustering of values around a central mean.
- LOG NORMAL - Displays data values transformed according to the relationship x = lnx, and the distribution of z values is displayed against the normal distribution curve.
- EXPONENTIAL - Distribution shows the frequency of values rapidly declining from a peak to a long tail or rising from a base level with increasing steepness.
Significance level
Enter the Significance level at which a Chi2 goodness of fit test is performed. The significance level is 100% – Confidence Level% (i.e.: 100% – 95% = 5%).
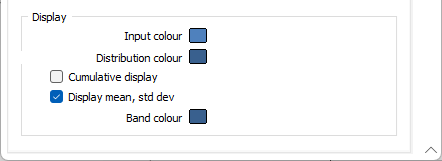
Display
Input Colour
Double-click on the Colour icon to select a colour for the Input field.
Distribution Colour
Double-click on the Colour icon to select a colour for the line of distribution.
Cumulative display
Select this option to display a cumulative graph of values.
Display mean, std dev
Select this option to display Mean and Standard Deviation as vertical lines. Double-click on the Band colour icon to select a colour for the bands between the lines.
OK
When you have set Input options and customised the Chart and the Axes of the graph, click the OK button to generate the graph.
Forms
Click the Forms button to select and open a saved form set, or if a form set has been loaded, save the current form set.