Chart | Cross Validation
The Chart window comprises the graphs you have chosen to include in the chart and the Properties Pane. Sample Location, True vs. Estimate, Standard Error, and Standard Error vs. Estimate charts can be generated to assess the cross validation result.
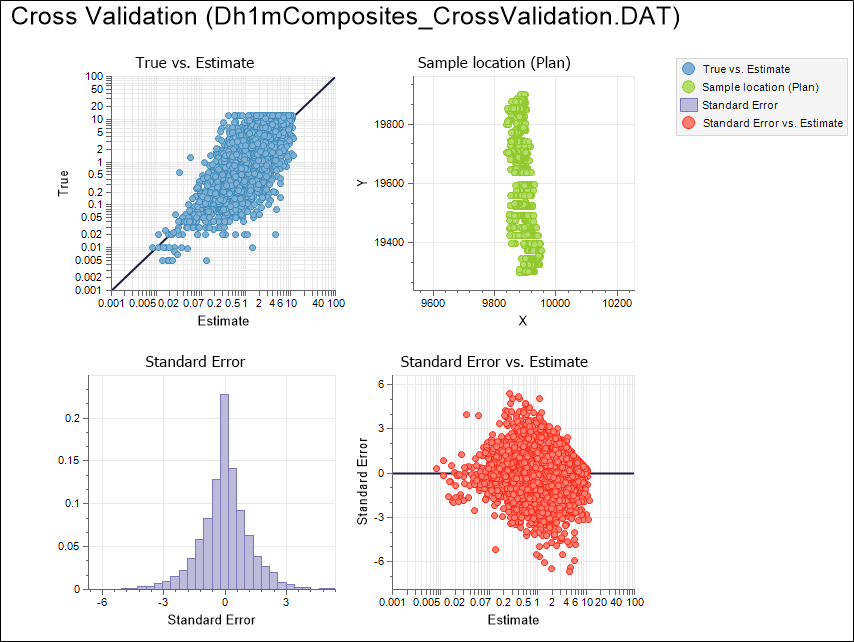
Mean, Variance, Standard Deviation, Minimum and Maximum stats are shown in the Properties Pane for the raw data and the estimated data. Count and Correlation Coefficient values are also shown.
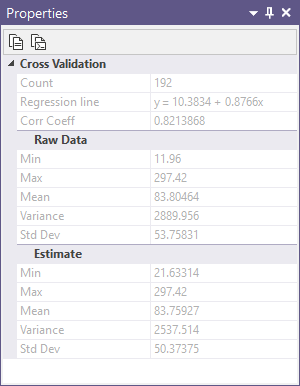
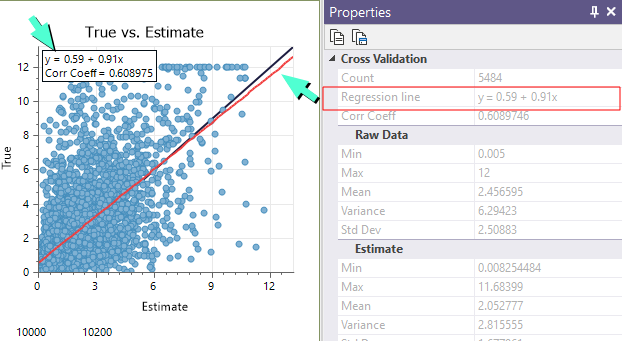
If you have chosen to show a regression line and/or equation on the Display tab of the form, those stats are also shown on the True vs Estimate chart and in the Properties Pane:
When you generate a chart, many of the tools and options on the Chart ribbon are common to most charts. See: Chart Tools
Tools on the Chart | Cross Validation tab, in the Cross Validation group, allow you to:
- Toggle the display mode between Multi-graph and Single graph mode:
- Click Next and Previous to move between graphs in Single graph mode:
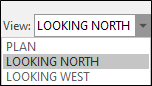
- Change the Orientation of the sample locations:
![]()
![]()
![]()
Forms
Click the Forms button to select and open a saved form set, or if a form set has been loaded, save the current form set.
By design, the Forms button is not available for loaded Vizex layers (i.e. when opening the form set properties of a layer in the Vizex Layer Display pane). In Vizex, the Forms button is only available for new forms opened via the Home tab or the Vizex tab, in the Layer group (or by double-clicking on a form type node in the Vizex Layer Types pane).
Save and Save As
Click the Save button to save the changes you have made to the form set. Click Save As to save your changes as a new form set. Save As will default to the first available form set number.
Reset
Click Reset to clear the form of all values and reset the form to its default state.
Reset Tab
For tabbed forms, select Reset Tab to clear the active tab of all values and reset the tab to its default state - without making any changes to other tabs in the dialog.
Undo and Redo
Click Undo (CTRL + Z) to undo recent changes in the form. After an Undo, click Redo (CTRL + Y) to restore the last change that was undone.
Collapse
Collapse (roll-up) the form to preview a chart, or preview the results of an operation in Vizex, or obtain input values from Vizex, the Property Window, the File Editor, or the Plot Editor.