Create Structural Trend
![]()
This function is also available on the Block Model tab, in the Variable Trend group.
To create a model which is optimised for Block Model Unfolding, see: Create Unfold Trend
Input
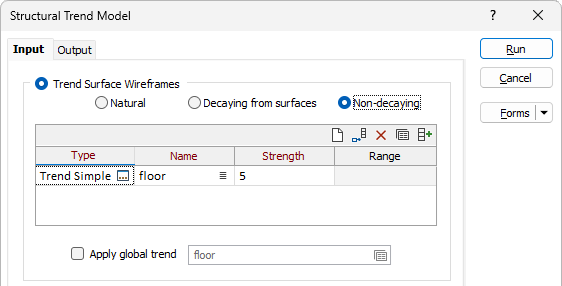
On the Input tab of the Create Structural Trend form, select Trend Surface Wireframes and set whether the trend is natural, decaying or non-decaying. Then select the wireframe(s) that will be used to model the trend.
Trend surface Wireframes
Decay
Select an option to specify whether the trend is Natural, Decaying from surfaces or Non-decaying.
The trend is shown using discs placed on a regular grid. The orientation of the disc gives the direction of the anisotropy. The size of a disc is proportional to its anisotropy strength. Where there are no discs (or the size is very small) the trend is isotropic and its strength weakens further away from the mesh.
-
If the trend type is Natural, an input structural data is simulated by selecting points on each trend surface and a trend ellipsoid is assigned to those points with the specified anisotropic strength. Essentially, structural data is generated from the trend surfaces and then a trend model is created from the structural data.
-
A blended trend is of the type Decaying from surfaces and its strength weakens further away from the mesh. A trend with higher strength will have a greater impact on the blending.
-
If the trend type is Non-decaying, the distance from the mesh no longer affects the anisotropy and all discs have the same size.
Wireframes
Select the Type and Name of the wireframes that will be used to model the trend.
Autofill Wireframes
![]() Click the Autofill button to populate the list of wireframes from a wireframe set. See: Autofill Wireframes
Click the Autofill button to populate the list of wireframes from a wireframe set. See: Autofill Wireframes
Note that only one trend surface can be selected in Non-decaying mode.
Strength
This parameter represents a stretching factor along the Z direction, which corresponds to the normals of the trend surface.
The default Strength value is 5. Set the Strength parameter to greater than 1 and the process will stretch the model in a direction normal to the trend surface.
Range
If left blank, Range defaults to the Trend grid cell size (see below).
With the decaying trend the amount of influence is determined by the distance from the surface. The decay trend model is a gaussian (or normal) distribution. The Range value equates to the real distance equivalent to 1 standard deviation of the gaussian distribution trend. The range value is in “grid units” (i.e. metres or feet) and is a real distance of influence of the surface.
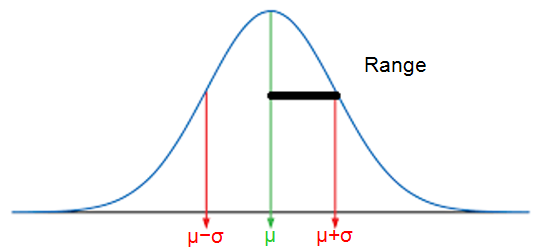
In practice this means that most of the influence of the trend surface is applied within the range distance from the surface.
Apply global trend
Select this option to define the trend in terms of a 3D ellipsoid. See: Ellipsoid Parameters.
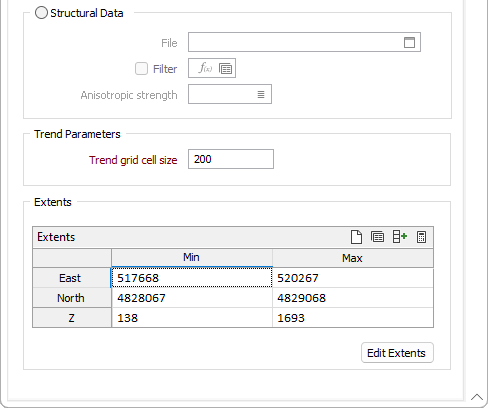
Structural Data
Select the Structural Data option to define a trend using the mapping points in a structural data file (.mmstruct).
Select the file containing the structural mapping information from the File field and optionally set a Filter.
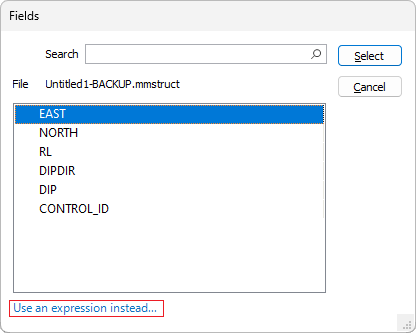
Use the Anisotropic strength field to select the field in the file which represents the anisotropic strength of the trend model. Alternatively, you can use an expression using the option in the Fields form. See Expression Editor.
Trend Parameters
Trend grid cell size
A cell size (in meters) is specified in order to generate a model that is small enough to assess the sensitivity but does not create such a large model that there is no solution. Typically, the grid size will be a 100th of the length along the trend axis.
Extents
East, North and Z fields
Specify the Minimum and Maximum extents of the surface in the East, North and Z directions.
Use the buttons on the local toolbar to Manage the rows in the list.
Click the Autofill Extents button to select the source of the extents you want to autofill.
Edit Extents
Click the Edit Extents button to collapse the form and visually adjust the extents, automatically aligning the extents to a restriction rectangle in Vizex. Interactively adjusting the extents rectangle in the Vizex display, or in the Vizex Property Window, will update the values in the form.