Quick Contours
![]()
Gridding is the process of creating a numerical array from unevenly spaced data. The entire area is divided up into a regular pattern – a grid. Because the samples (data points) are usually not regularly spaced, values are estimated for "grid points” using the surrounding samples.
This process results in a surface which does not necessarily honour the original data points. Remember this when contouring topographic or other surfaces. When dealing with geophysical and geochemical data this does not pose problems, as surface being contoured is never precisely known. If you wish to create contours that precisely follow a set of points, use the Contours function on the Grid / DTM tab, in the DTM Create group.
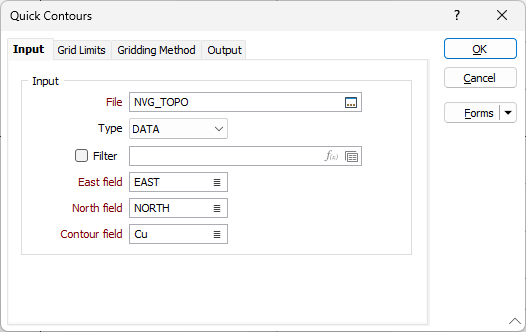
On the Input tab of the Quick Contours form, specify a file containing X, Y and Z data points as input. Typical data sets include: the surface of the Earth; the thickness of a rock unit; the salinity of an estuary; soil geochemical samples; magnetic or gravity profiling; drilling results; topographic surveys.
File
Enter or double-click (F3) to select the name of the file that contains the data you wish to contour. If required, define a filter to selectively control which records will be processed.
You can select a contour grid file (*.GRD) as the input if you wish to reprocess a data set you processed previously. Use a stored grid file when you have a large data set you wish to contour at a different interval. Note that you cannot generate a GRID type output file.
Contour field
Enter the name of the field containing the data to be contoured.
X and Y fields
Double-click (F3) to select the names of the fields that define the X and Y axes of the display.
Contouring drillhole sections
When contouring drillhole sections, the input data must have (3D) coordinates for Z and either Easting or Northing. These are normally generated using the XYZ Coordinates tool on the Drillhole tab, in the Generate group.
You must limit the data input to the contouring function to a narrow search corridor in the same way that the data on a drillhole section is limited by the display window. Do this by setting up a filter.
For example, when displaying a North section, the X field of a display will represent Easting values and the Y field elevation. Setup a filter to limit the range of Northing values that will be passed to the function. If a section was on 10,010m North with a Data corridor (Display window) of 20m, setup the filter to pass all data in a range 10,000 North to 10,020 North.
Run
Set the grid limits, the gridding method, and output options. Finally, click Run to generate the files.