New Grid
This function is also available on the Stratigraphic tab, in the Grid Create group.
![]()
The end result of the gridding process are blocks or cells containing estimated values. A large block size will be fast to compute but will produce a coarse map, while a small block size will be slower to compute but will produce higher resolution. In general, a good starting point is to make the grid spacing approximately equal to the maximum raw data point spacing.
In most cases you will have to carry out some trial and error processing to determine the optimum settings for the parameters in the various tabs of the Grid Create form.
On the Input/Output tab of the Grid Create form, specify the name of an Input file and an Output file, and the names of the required fields in the Input file.
Input
File
Double-click (or click on the Select icon) to select the name of the file containing your data.
Grid field
Double-click to select the name of the field containing the values that will be used for the calculations.
X, Y fields
Double-click to select the name of the fields containing X, Y and, optionally, Z coordinates (see below).
Z field
This input is enabled when a Transform projection plane is defined, or when the option to use the input point file extents to auto calculate a plane of best fit is selected.
If the projection plane of the grid is an orthogonal PLAN view, the origin is set to zero and the input box is disabled.
Output
Grid file
Double-click (or click on the Select icon) to select the name of the Grid file. The output generated by the process will be written this file.
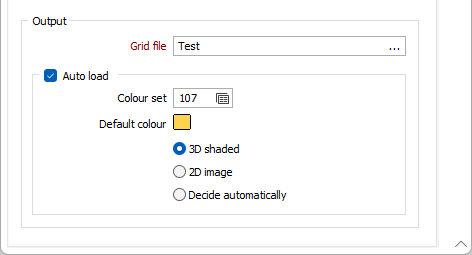
Auto load
If you have chosen to load the grid in Vizex, specify how the grid will be colour-coded.
Colour Coding
Double click (F3) to select the Colour set and the Default colour that will be used to control the display colour.
The colour set maps colours to text strings or numeric ranges. Right click (F4) to create or edit a colour set. The Default colour will be used when a colour set is not defined.
Draw Style
Select a Grid Surface Draw Style:
| Style | Description |
|---|---|
| 3D Shaded | This draw style cannot be plotted. When plotted, it is drawn as 3D lines. |
| 2D Image | Select this option to view the grid surface as a flat 2D projection. |
| Auto |
When the Auto option is selected, a 2D Slice draw style is applied when the current view is clipped. Otherwise, a 3D Shaded (Hollow) draw style is applied. |
Forms
Click the Forms button to select and open a saved form set, or if a form set has been loaded, save the current form set.