Trend Removal
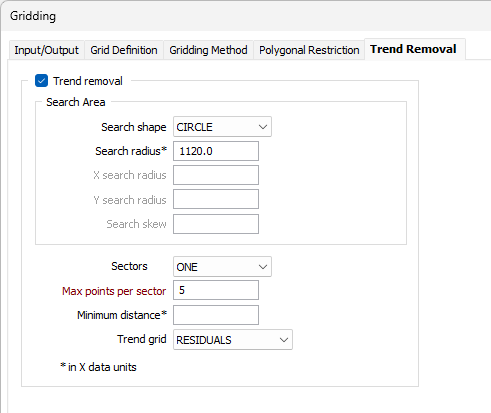
The Trend Removal tab of the Gridding form allows you to define a search circle or ellipse in exactly the same way as for the Search tab. The estimate written to the Output file is determined by the parameters you define:
The Trend removal option performs a first order, large scale trend removal. The grid file produced is the result of a mathematical operation between the data search estimate and the trend removal estimate. Trend removal is often used to emphasise local anomalies.
You would not normally use this with the KRIGING method as that method has the option of drift removal which achieves the same purpose. Trend removal is also not available with the MINIMUM CURVATURE methods.
Trend removal
(Optional) Select the Trend removal box if you want to eliminate regional trends from your data and optionally emphasize local anomalies. This is unavailable for the MINIMUMU CURVATURE methods and the NEAREST NEIGHBOUR method, and is not normally used with the KRIGING method.
Search shape
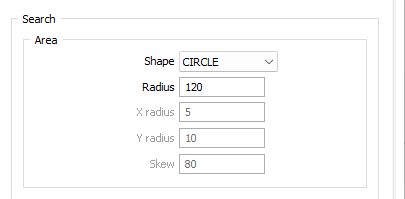
You can select either a CIRCLE or an ELLIPSE as the search area shape. A circle is more usual unless the data is concentrated in some way that suits an ellipse better.
Search radius
When the search shape is CIRCLE, accept [AUTO] as the default or enter the radius of the data search circle in X axis units.
When the search radius is unspecified [AUTO], it is automatically calculated as 10% of the grid's size in the X dimension.
X and Y Search radius
When the search shape is ELLIPSE, accept [AUTO] as the default or enter the radius of the search ellipse in the X and T directions. In general, a good starting point is to make the radius about 1.5 to 2 times the grid surface spacing.
When either the search X radius or Y radius are unspecified [AUTO], they are automatically calculated as 10% of the grid's size in the X dimension.
Search skew
A search ellipse can be skewed if an examination of the raw data suggests this may improve the fit of the grid surface to the data. Enter the rotation of the search ellipse in degrees, measured clockwise from zero at the top of the screen.
Use points outside grid limits
(Optional) Select this option if you want to include points outside the grid surface limits (but within the search ellipse).
Sectors
This number defines how many parts the search shape will be divided into for the data search.
The maximum number of points is multiplied by the number of sectors to determine how many data points can be used within the overall search shape. For example, if you choose FOUR sectors, the search shape is a circle, and the maximum number of points is 15, then the nearest 15 data points in each quadrant will be used, totalling 60 points.
This option can eliminate the clustering effects of irregularly spaced data.
Max points per sector
The maximum number of points to be used in the estimation of a block value. This input is compulsory. Enter a value which is greater than zero. The maximum allowable value is 150.
When more than one sector is defined, each sector can independently use up to the maximum number of points.
(e.g. 150 pts x 4 sectors = 600 pts)
If more than the maximum number of points is found within a sector the closest points are used.
Minimum distance
Enter a minimum distance in X data (axis) units. The estimation algorithm will use this as the distance between a data point and the centre of the block being estimated.
This deals with the situation where the value of a data point very close to the centre of the block being estimated becomes in effect the value of the block, overpowering the effect of other data points found within the search ellipse.
If the distance between a data point and the block centre is less than the value entered here, the value entered will be used instead of the true distance.
Duplicate points
Choose how the function should deal with Duplicate points: IGNORE, AVERAGE or take the MAXIMUM or MINIMUM value. Duplicate points are those with the same coordinates but different data values.
Note: Duplicates are defined by their X-Y location. If an X-Y combination exists, the first instance is used. All other instances of that X-Y combination are treated as duplicates and ignored.
See: Duplicate Points
Trend grid
When you select this option, choose which data will be output.
- RESIDUALS: the trend removal estimate is subtracted from the data search estimate to calculate the residual value.
- ORIGINAL + RESIDUAL: the data search estimate is added to the residual, making it the trend value plus twice the residual value.
- TREND: the residual is subtracted from the data search estimate to give the trend estimate.
If trends are suspected in the data, rotate the ellipse to align its long axis to the trend direction. Note that this approach to trend removal is fairly simple and you should take care not to unintentionally mask an important trend in the data. The Trend Surfaces function offers a choice of first, second and third order trend surface generation and should be considered if the trend removal here is not suitable.
Run
When you have set input and output parameters and optionally applied a polygonal restriction, click Run to begin the process.