Output
Using a grid file as source, you can use the Create Contours function to create a contour display and also output the contours as a string file. The contour display can show values as shades (blocks filled with colour) or as blocks containing the values.
On the Output tab of the Create Contours from Grid form, you can choose to auto load the contours in Vizex. In addition, you can control the width, colour and labelling of the contour lines.
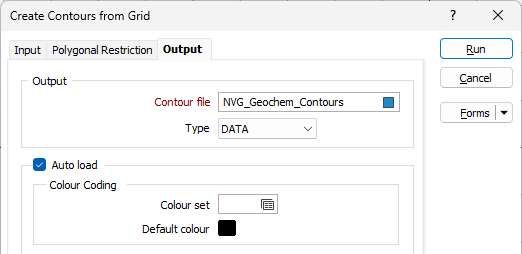
Output
Contour file
Double-click (or click on the Select icon) to select the name of a Contour file. The output generated by the process will be written this file.
Auto load
Select the Auto Load option to load the created contours in Vizex.
Label Contours
If you have chosen to load the contours in Vizex, select this option to specify how the contour lines will be labelled and colour-coded.
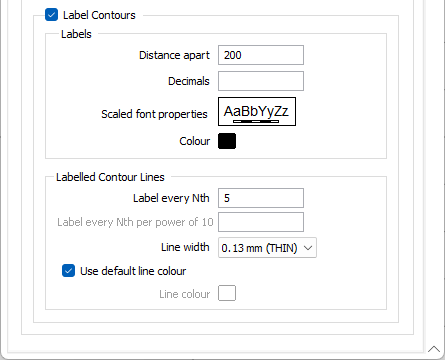
Distance apart
Type in a value in grid units for the Distance apart, that is, the distance between adjacent labels as measured along the contour line.
A small label distance will result in contour labels being closely spaced. A large distance value may result in no labels appearing on a contour line at all, particularly if the line is short. Labels are only drawn on a contour line if it is longer than the distance apart.
Decimals
Specify the number of Decimal places that will be displayed when labelling numeric values.
Label every Nth
The Contour interval parameter defines which contour lines will be labelled.
The Label every Nth value is defined in units of “contours”. A value of 5 will label every fifth contour starting from the lowest.
So if, for example, a data set is being contoured with a minimum contour of 0, a maximum of 100, and a contour interval of 5, setting Label every Nth to 5 would mean that contours are labelled at 0, 25, 50, 75 and 100. A Label every Nth value of 4 will put the contours at 0, 20, 40, 60, 80 and 100.
If no Contour minimum is set, a default Contour minimum is applied which ensures that labels are positioned on contours which are multiples of the Contour interval * the Label (every nth) spacing.
Contour labels per power of 10
If you have chosen Logarithmic Spacing as the Spacing type on the Input tab of the form, the Label every Nth option is not applicable.
Instead, in the Label every Nth per power of 10 input, enter the number of intermediate contours from 0 to n, where n is the Contours per power of 10 value you specified on the Input tab.
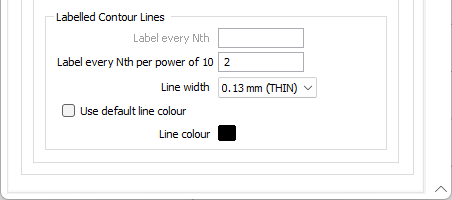
Line width
Choose a (THIN, MEDIUM, THICK, or custom) line width for the contour lines.
Use default line colour
Select this option to use a default line colour, Double-click on the Colour icon to set the colour.
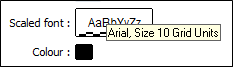
Scaled font
Double-click on the Scaled font preview box to select a scaled font for the labels.
The Font preview size in a form is always shown as 12 point, regardless of the font size chosen in the Font dialog. However, if you hover the mouse over the Font preview box, details of the current font are shown. The size of the font is shown as “Grid Units”.
Colour Coding
Double click (F3) to select the Colour set and the Default colour that will be used to control the display colour.
The colour set maps colours to text strings or numeric ranges. Right click (F4) to create or edit a colour set. The Default colour will be used when a colour set is not defined.