Contours
![]()
Contours are lines connecting points of equal Z value. When you create a DTM, a Z field is defined and these Z values can be contoured using the Contours function. The DTM is a triangular mesh with each vertex being a point in the data file that was used to create the DTM. Each vertex has an associated Z value and each triangle side defines a constant slope between two known points.
So, if two vertices of the same triangle have Z values of 19m and 21m, then half way along the connecting side the Z value will be 20m. If a specific Z value “enters” a triangle by intersecting one of its sides, it must “leave” the triangle by one of the other two sides, thereby “entering” an adjacent triangle. A contour line is generated by tracking a specific Z value in this way.
The Contours file can be loaded as a layer in Vizex. The Contour file has the fields X, Y, Z and JOIN. When displaying contours, Z is defined as the String field and JOIN as the Join field, to ensure that the contours display correctly. Labels are not written to the Contour file.
Wireframe Input
In the DTM Contour form, specify the Type and Name of the input wireframe:

Output
Contours written to the Output file are based on the Z values of the DTM.
Contour interval
Enter a Contour interval which defines the spacing between contour lines.
Contour minimum and maximum
Enter the Contour minimum and maximum values to restrict the range of contours.
Smoothing
If Smoothing is not applied, then the intercepts on the triangle sides will be connected by straight lines, often resulting in “jagged” contours. Use the slider bar to determine the degree of smoothing of the contour lines.
Straight line contours will never cross, however there is no guarantee that smoothed contours will not cross.

Auto load
If you have chosen to load the contours in Vizex, specify how the contours will be labelled and colour-coded.
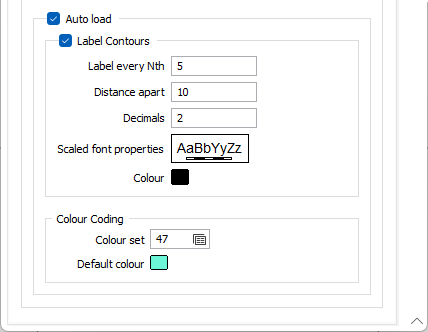
Label every Nth
The Contour interval parameter defines which contour lines will be labelled.
The Label every Nth value is defined in units of “contours”. A value of 5 will label every fifth contour starting from the lowest.
So if, for example, a data set is being contoured with a minimum contour of 0, a maximum of 100, and a contour interval of 5, setting Label every Nth to 5 would mean that contours are labelled at 0, 25, 50, 75 and 100. A Label every Nth value of 4 will put the contours at 0, 20, 40, 60, 80 and 100.
If no Contour minimum is set, a default Contour minimum is applied which ensures that labels are positioned on contours which are multiples of the Contour interval * the Label (every nth) spacing.
Distance apart
Type in a value in grid units for the Distance apart, that is, the distance between adjacent labels as measured along the contour line.
A small label distance will result in contour labels being closely spaced. A large distance value may result in no labels appearing on a contour line at all, particularly if the line is short. Labels are only drawn on a contour line if it is longer than the distance apart.
Decimals
Specify the number of Decimal places that will be displayed when labelling numeric values.
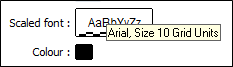
Text properties
Double-click on the Text properties font preview box to select a scaled font for the labels.
The Font preview size in a form is always shown as 12 point, regardless of the font size chosen in the Text Properties dialog. However, if you hover the mouse over the Font preview box, details of the current font are shown. The size of the font is shown as “Grid Units”.
Colour Coding
Double click (F3) to select the Colour set and the Default colour that will be used to control the display colour.
The colour set maps colours to text strings or numeric ranges. Right click (F4) to create or edit a colour set. The Default colour will be used when a colour set is not defined.