Statistics
This
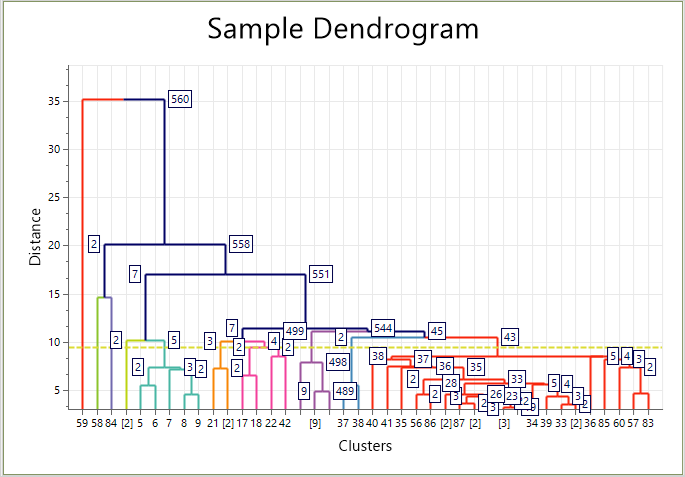
Dendrogram Tool
The Dendrogram tool has been added to the Stats tab, in the Transformation group.
![]()
Dendrograms enable the visualisation of hierarchical clustering data in a graph with a tree-like structure. The similarity or difference between clusters is shown on the Y axis as a distance. Clusters that are more different will split at a greater distance, higher up the Y axis. Related clusters are connected to each other and to other related clusters by branches - similar to a genealogical chart (aka 'Family Tree').
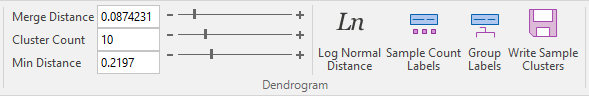
In the Chart | Dendrogram ribbon, along with the Chart Tools common to most charts, the Dendrogram section contains chart-specific tools to configure the Dendrogram.
For more information on the new tool, see Dendrogram.
Hierarchical Agglomerative Clustering
Support for Hierarchical Agglomerative Clustering has been added to Data Clustering on the Stats tab, in the Transformation group .
![]()
A distance-based algorithm is used to cluster data in a hierarchy, in the same way as a Dendrogram is calculated. A Single, Complete, Average or Median calculation algorithm can be selected for Hierarchical Agglomerative Clustering. The Number of clusters can be entered for the new method, and the Maximum iterations value will be disabled.
For information on how the new method clusters data, see Clustering
HDBScan Clustering
Support for HDBScan density-based clustering has been added to Data Clustering on the Stats tab, in the Transformation group .
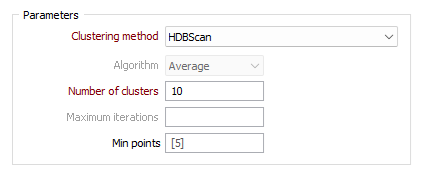
HDBScan uses density-based spatial clustering and integrates results to find a clustering that gives the best stability. Hierarchical density-based scanning is able to find clusters of varying densities and is adaptable to diverse selection parameters.
For information on how the new method clusters data, see Clustering
Stereonet Strike (RH) Display Options
Plane orientation convention options have been added to the Legend tab of the Stereonet chart on the Stats tab, in the Charts group.
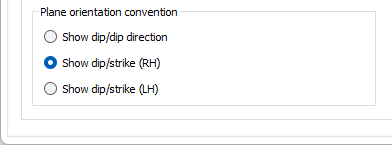
The new options provide support for displaying the Strike in either the right hand or left hand convention. The selection will apply to any of the mean planes (data or group/s).
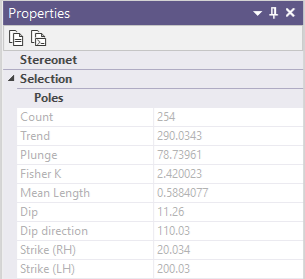
Additionally, if you click on a mean plane line in the Stereonet chart to select it, you can view its Properties from the pane. Dip Direction, Strike (RH) and Strike (LH) properties are displayed, regardless of whether dip direction or strike were used for the input.
Stereonet Points Display Symbols
Support for displaying points as different symbols has been added to Stereonet charts on the Stats tab, in the Charts group.
A default symbol, the symbol field and a symbol set can be specified on the new Structures tab for the display of Poles and Linear Structures.
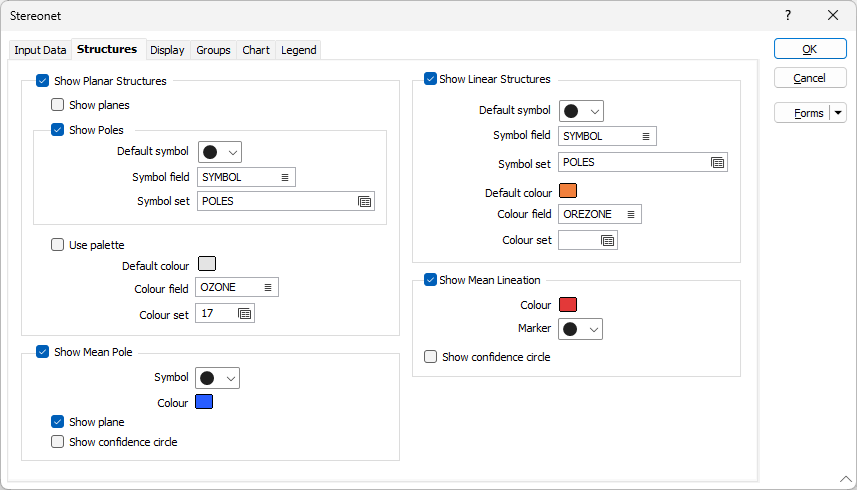
Selected symbols can be displayed using the colour palette for the chart, or a default colour, colour field and colour set can be selected.