Dependency Segments
Dependency Points and Dependency Segments layers are available within the Vizex view when a schedule is opened. This makes it possible to visually check generated dependencies for compliance with the requirements of a particular mining method.
Points which represent the centroids of source tasks are connected by strings to their corresponding destination tasks. Filtering Options include Dependency Type. Display Options include Dependency Type, Connection Type, Lag Size and Lag Type. When enabled, the content of the layer is updated automatically as changes are made in the Gantt Chart, when new tasks are imported and when auxiliary tasks are created or recreated.
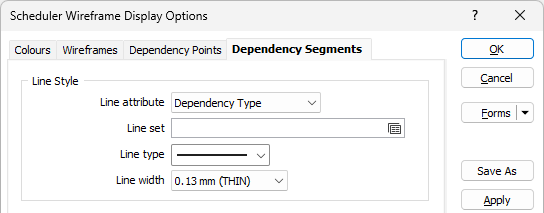
Use the parameters on the Dependency Segments tab to set display options for the segments.
Line Style
Line sets give you the ability to apply different line styles and line widths to the polylines in a single dataset. You can apply them in the same way that you can apply colours, hatches and symbols to your data.
Line field
Double-click (F3) to select the name of a field that will be matched to the code values in a Line set.
Line set
If you have specified a Line field, double click (F3) to select the set that will be used to control the style and the width of the polylines in the dataset.
Line type
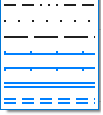
Select a line type. A preview of each line type is shown in the drop-down list. A variety of solid, dotted, and dashed line styles are available for selection.
Note: Extended line styles such as double lines are not compatible with 2D plots (they will render as a solid line) and will only display properly in Vizex and 3D Vizex plots (and screenshots). Extended line styles are displayed in blue in the Line Type drop down.
Line width
Select a (THIN, MEDIUM, THICK, or custom) line width from the drop-down list. An extensive selection of custom widths (in millimetres) are available for selection.
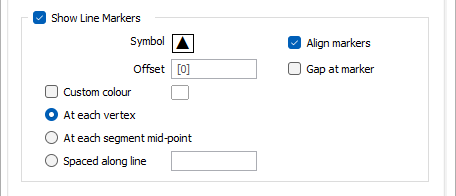
Show Line Markers
Select this check box to draw symbols at specified points along the lines. Double-click on the icons to select a symbol and a colour for the markers.
Align markers
Select this check box to align the markers so that they match the orientation of the line.
Gap at marker
Select this check box to show a gap in the line at the position of each marker.
Custom colour
By default, line markers are given the colour of the corresponding dependency type, Select this check box to override those colours with a custom colour. Double-click (F3) to select a colour.
Offset
To offset the markers rather than position them on the linem specify an offset value in grid units.
You can choose to position the markers:
- at each vertex
- at each segment mid-point
- spaced along the line at a specified distance
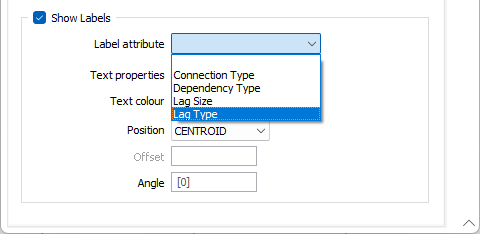
Show Labels
Select the Show Labels check box to label the dependency segments by choosing a label attribute such as Connection type or Dependency type. See: Dependencies
Label attribute
Select a Label attribute. If you leave the field empty, only the label points are displayed.
Text properties
Double-click on the Text Properties Preview box to select a font and set text properties.
Text Colour
Double-click (F3) to select the colour of the text.
Position
The position of the segment annotation. You can choose to display the label ABOVE or BELOW the segment or on the CENTROID of the segment.
Offset
To offset the label text, specify an offset value. Offset units are "Character" widths, not grid units.
Angle
Specify the angle (0° to 360°) at which the annotated text will be drawn. An angle of 0° results in vertical (up) text. An angle of 90° is the default and results in horizontal (to the right) text, etc.