Generate Ring Plot
![]()
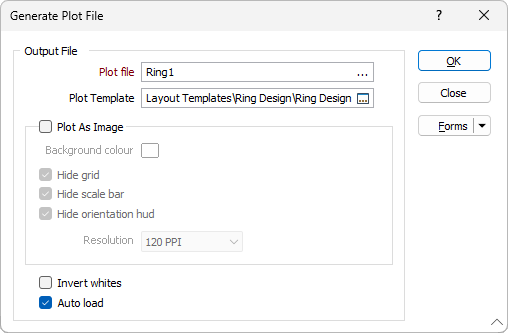
In the Generate Plot File form, you can choose to generate a plot file or generate an image.
Click the OK button to generate the Ring plot (or image).
The data contained in each frame of the plot layout is extracted from the Ring database and is stored in a temporary (.DAT) data file in the \Ring DesignDATfiles subfolder of the current project folder.
To avoid naming conflicts and the possibility of files being overwritten when ring names commonly occur across different ring design layers, the Micromine Ring Database File name is added as a prefix to the Ring Name and the Plot File Name.
The temporary files associated with a Ring plot file are automatically deleted whenever you delete the Ring plot file.
Note: If multiple rings have been selected, the Generate Plot File dialog will remain open and the Plot file name will be incremented for the next ring. Click OK to generate subsequent plots (or Cancel). If a large number of rings are selected, use the Generate Batch Rings Plot option instead.
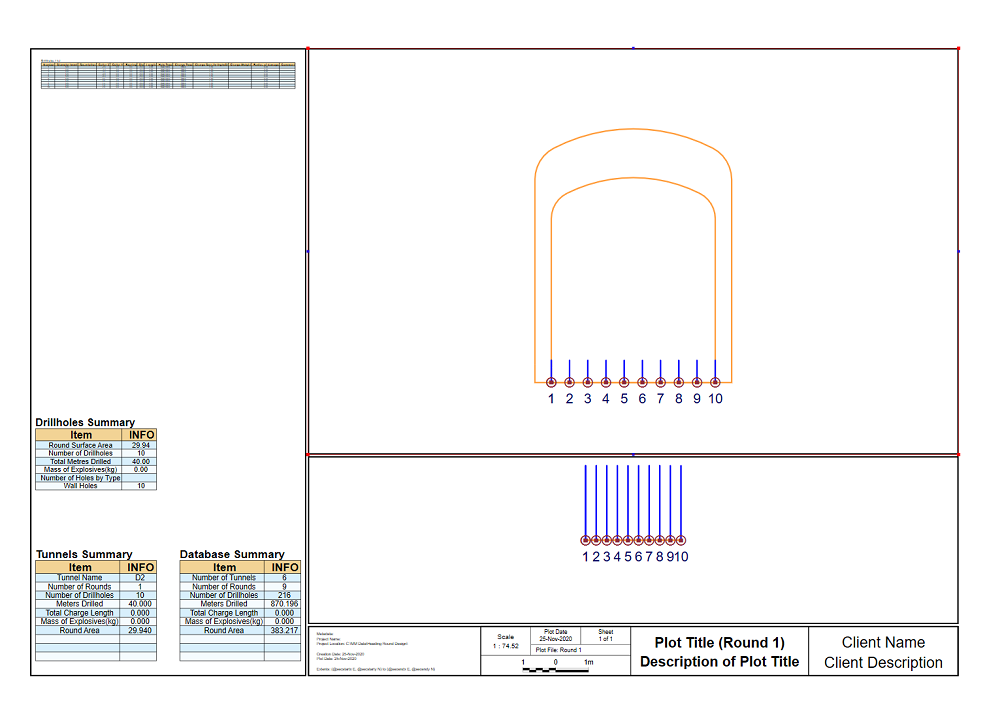
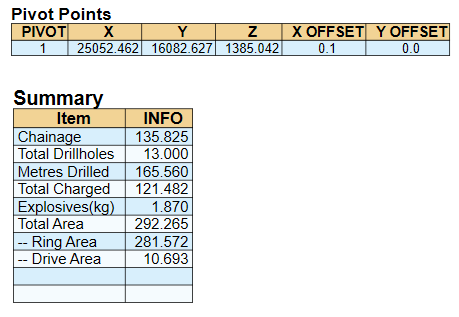
The details of each ring and pivot points are shown. The number of holes, the total length of the drilled holes, and the amount charged for individual diameters are shown in a Ring Plot Summary.
Note: From v20.5 onwards, if a Ring Design consists of both planned and as-drilled drillholes, only the as-drilled holes are included in a Ring Plot.
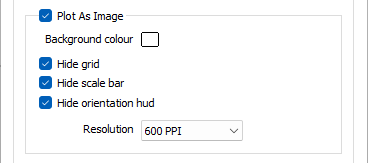
Plot as Image
To generate an image of the display, select the Plot as Image option. The following files are saved to the current project folder:
- A JPEG (.JPG) image file
- A georeference (.GRF) file
- If the view is in Plan, a MapInfo TAB file and a World file.
Background colour
When you create an image, you can set the background colour and choose a resolution for the file. The image will be produced in 24 bit colour.
Resolution
A 300 dpi image will be around 7MB in size. For screen display, 72 dpi is generally fine. To produce bitmaps suitable for advertising material and inclusion in reports, 300 dpi is generally a good resolution. If you have chosen to create an image with a very high resolution, it may take a few moments to create.
On the Vizex tab, in the Capture group, you can generate an image of the display by selecting Generate Screenshot. In this case, the name, location, and format of the image file can be selected.
Hide
Use the check box options provided to show or hide the reference grid, the scale bar and orientation arrows. These options are selected (hidden) by default.
Invert Whites
Select this option to invert white polylines and their associated labels. This is useful when working with white polylines on a dark background in Vizex. Note: This option is unavailable when the Plot as Image check box is selected.
Auto Load
Select this option to automatically load the displayed data in Vizex. The plot will be opened using the selected template or (if blank) a default template. You can then edit the layout to suit your requirements.