Trend Surfaces
![]()
The choice of output results depends on whether you want to see the global trend or emphasize local anomalies.
Note that this function does not itself produce a display. In the case of Data file output, you need to use the New Grid function before you will be able to view the results via the Display Layers > Contour option (on the Home tab or the Vizex tab, in the Layer group).
Input file type
Select a (GRID or Micromine Data file type and enter (or double-click to select) a file of that type. If you selected a Microminefile, optionally define a filter to selectively control which records will be processed.
X, Y, Z fields
If you selected a Micromine file, double-click to select the names of the fields containing X, Y and Z coordinates.
Trend surface
Choose the type of Trend surface (LINEAR, QUADRATIC or CUBIC). This determines the order of the equation used for the calculation, and your choice will depend on the source data. The aim is to minimise the variance between the measured points and the trend surface. In general, higher order equations give better results but take longer to calculate.
Output format
Choose the Output format. If you select TREND SURFACE, the output data will represent the calculated trend surface. If you select RESIDUALS, the difference between the original data and the trend surface is written to the output file (to emphasize local variations). Output Types
Output file
Enter or double-click to select the Output file name. Only a file of the same type as the input file can be selected.
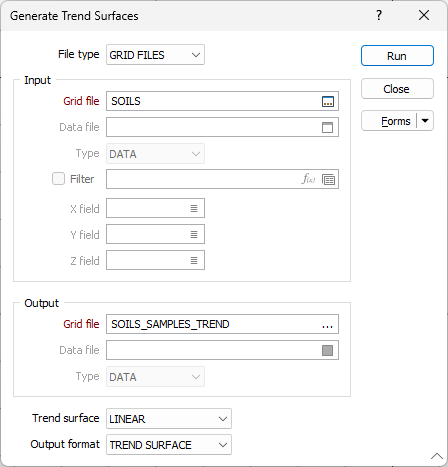
Run
Finally. click Run to generate the Output file.