Drillhole Log
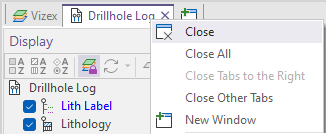
The Drillhole Log display is opened in a dedicated window.
![]()
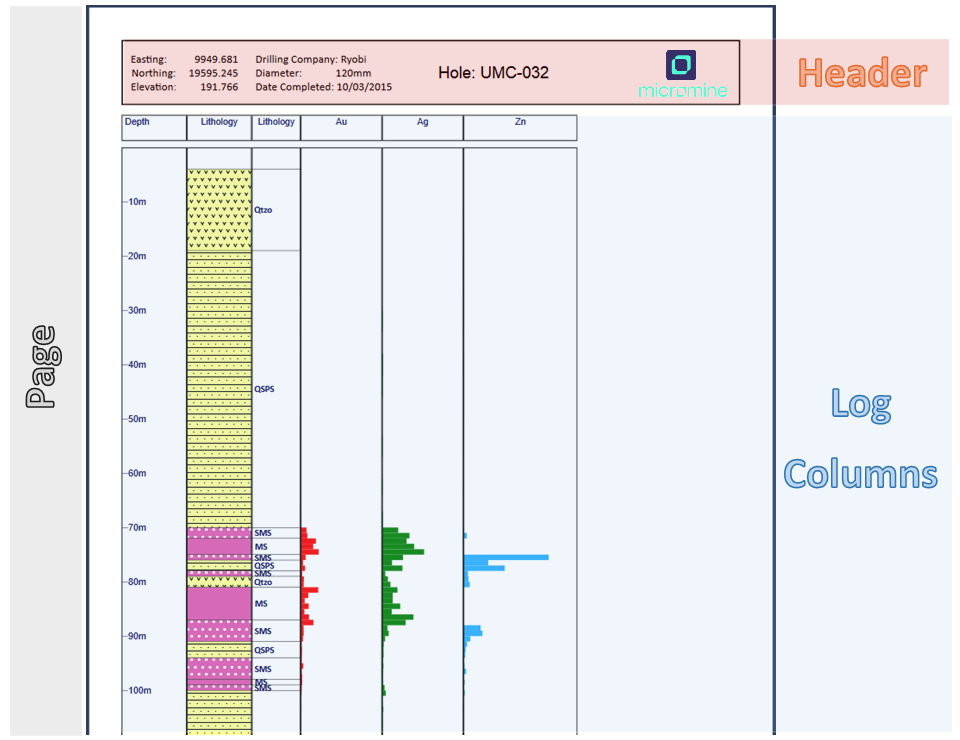
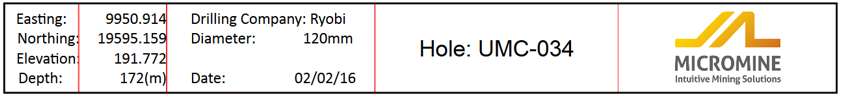
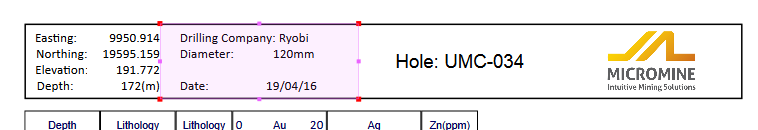
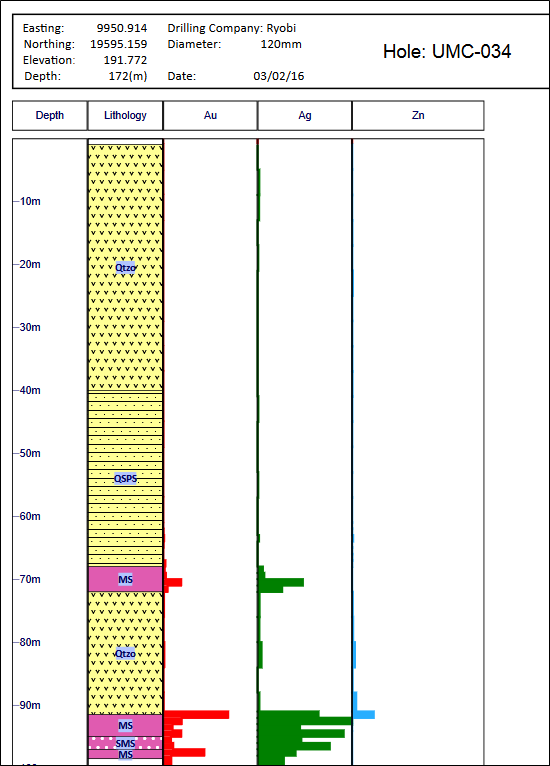
The layout of a log is as shown below. There is an equivalent Footer region at the bottom of the page:
Page Setup
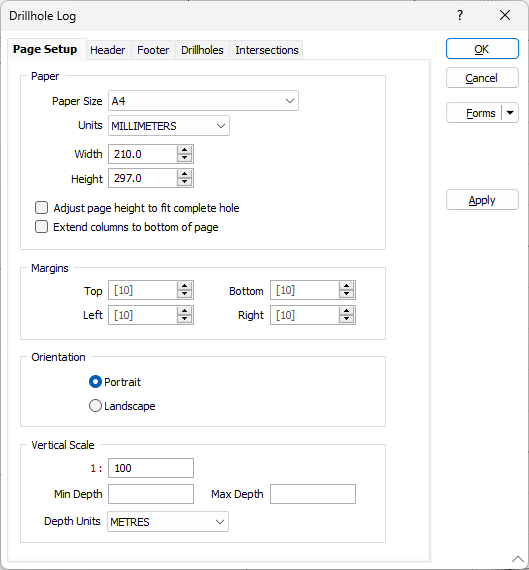
On the Page Setup tab of the Drillhole Log form, specify the paper size, margins, page orientation and vertical (or down hole) scale.
Paper Size options are associated with the (system) default printer. The units chosen here will be used by all position, size and offset related prompts on this, and other, tabs.
The margins and orientation define the basic page layout.
The compulsory Vertical Scale effectively determines the depth range per page.
A useful feature is the way Default values for undefined parameters are shown inside square brackets []. These can be overwritten, but if they are blanked out the default value returns.
Header
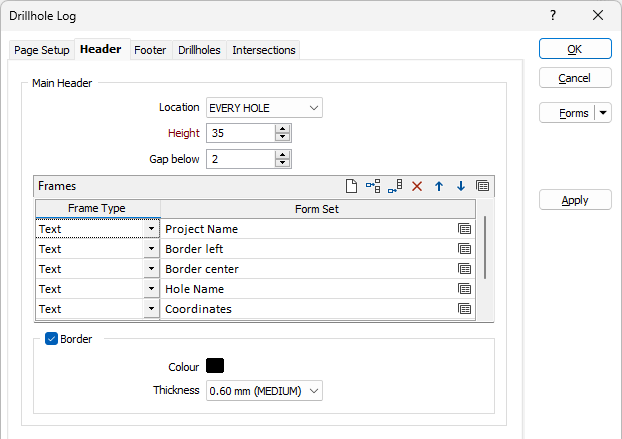
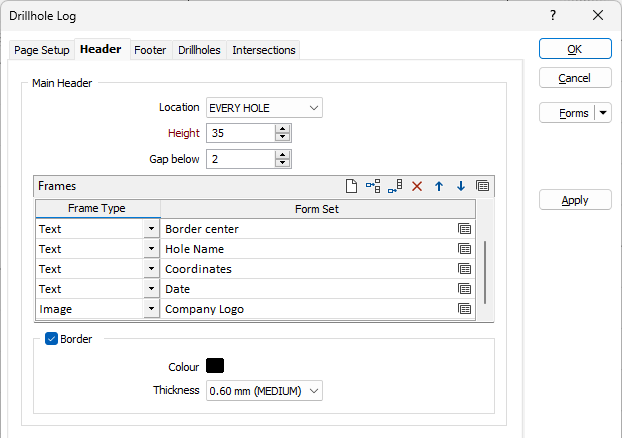
The Header tab controls the size and content of the Main Header, as well as the size of the Column Header area (the individual column header “content” is part of each column’s definition).
The Main Header is positioned at the top of each page. It consists of an “empty” frame that extends across the width of the page. The height of the frame is defined in paper units (typically millimetres). Selecting the option to show a Border enables the Border Colour and Line Thickness prompts.
The Main
- The first column defines the frame type, Text or Image or Empty.
- The second column selects a form set that defines the content, position and size of the frame.
Initially there will not be any form sets. To define a form set:
- Select the frame type, in the first column, and then right click on the second column, and select New.
- You will be prompted for a form set name. Type in a suitable (descriptive) name and click OK.
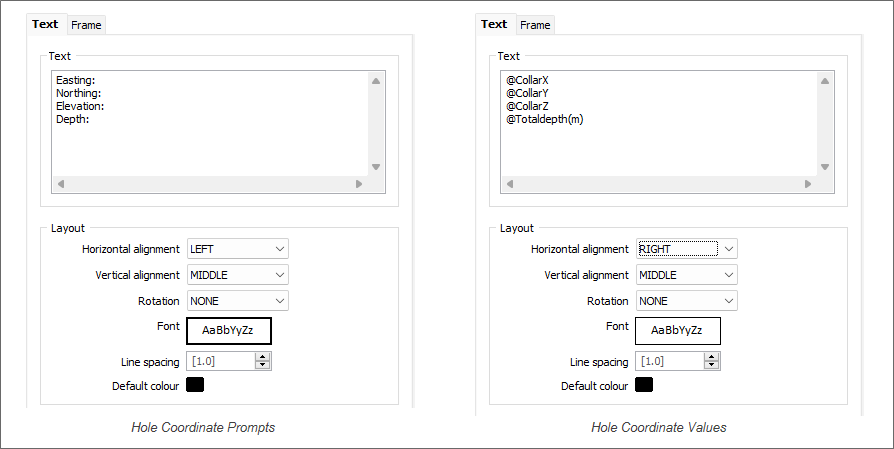
A blank form will be displayed with two tabs. The content of the frame is defined on the first tab and the position and size of the frame is defined on the second tab.
It is important to give the frame some non-zero size and an approximate position. Leaving the initial default values means that the frame will not appear because it has no defined width and height. The actual size and position of the frame is not critical, as these values can be modified interactively later on.
The content for an Image frame is an image file. Typically this might be a company logo.
The Undo/Redo function is enabled for use with header and footer frames and captures the movement and resizing of frames.
Note: Making changes to the drillhole log via the form, will clear the undo stack. This ensures that where a frame referenced in the undo stack is removed, undo/redo operations will not affect frames no longer displayed.
Macros
When you view a Drillhole Log, options are provided which allow you to navigate the holes and send output to the printer.
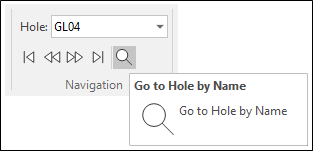
These are also available as macro commands:
| DHLOGNEXT | Move to the next hole |
| DHLOGPREV | Move to the previous hole |
| DHLOGLAST | Move to the last hole |
| DHLOGFIRST | Move to the first hole |
| DHLOGBYNAME | Go to hole by name |
| DHLOGPRINT | Print the current hole |
| DHLOGPRINTALL | Print all holes |
If the "Plot File" field is filled in for the DHLOGPRINT or DHLOGPRINTALL command, by default the output will be sent to the specified file in the current project folder. When printing to PDF or XPS this avoids interrupting the macro to prompt for the output file name.
When printing to PDF or XPS, the file extension must be included in the Plot File name.
To automatically close the drillhole log at the end of the macro, select the File | Close macro process.
Substitutions
The content of a Text frame can be typed into a text box. As well as user-defined text, there are a number of pre-defined substitutions. These pre-defined substitutions are split into 2 types, Global and Drillhole Log specific:
| Global | |
|---|---|
| @ddmmyy or @mmddyy | @projtitle |
| @time | @username |
| @yyyy | @networkdomain |
| @mm or @month | @licenceID |
| @dd | @mmversion |
| @project | @computername |
| @projdir | @windowsversion |
| Drillhole Log |
|---|
| @Hole = Current hole name (Multiple Hole ID fields are concatenated) |
| @Hole1 = Current hole name (Hole ID field 1) |
| @Hole2 = Current hole name (Hole ID field 2) |
| @Hole3 = Current hole name (Hole ID field 3) |
| @CollarX = X coordinate of current hole collar |
| @CollarY = Y coordinate of current hole collar |
| @CollarZ = Z coordinate of current hole collar |
| @CollarInclination = Inclination of current hole |
| @CollarAzimuth = Azimuth of current hole |
| @TotalDepth = Total depth of current hole |
| @Page = Current page number for the current hole |
| @Pages = Total number of pages for the current hole |
| @TotalPage = Current page number across all holes |
| @TotalPages = Total number of pages across all holes |
| @Attribute1-10=collar attributes per the DHDB |
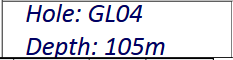
So typing in the text:
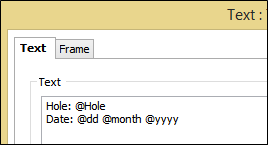
Would display:
Once the parameters have been defined, click OK to both save the form and post the newly-defined form into the grid list.
Repeat this process for all “child frames” contained in the “parent” (Main Header) frame.
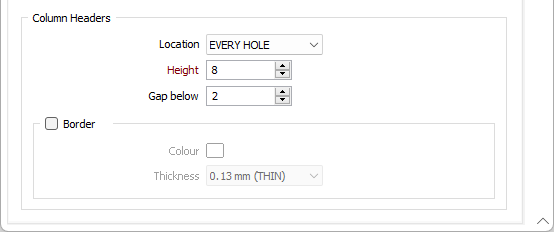
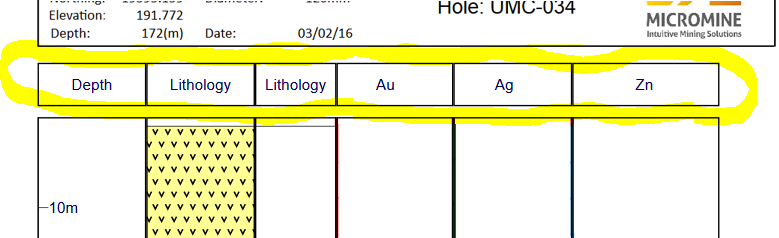
Column Headers
If you want to display Column Headers (usually you will) select EVERY HOLE or EVERY PAGE from the Location drop down. You can then define the height of the region used by Column Headers (the columns are the elements of the drill log, such as the depth scale, hatch, text or graph) and the vertical gap between both the Column Header and the Columns.
An Example:
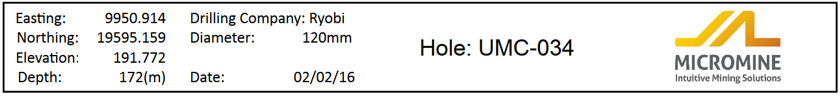
The screenshot above displays the border of each child frame. In the screenshot below, the frame borders are turned off:
The five frames are referenced in the Main Header grid list:
The easiest way to edit, resize or reposition any of the child frames is to click on a frame to select it and interactively move and/or resize it. (If there are overlapping frames then a second click will select the next frame).
Double click on a frame to open the underlying form and modify the content or layout parameters.
Footer
Follow the same principles as the Header.
Drillholes
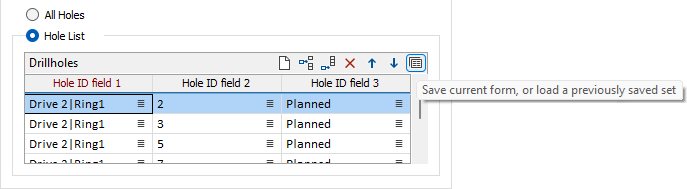
The Drillholes tab of the Drillhole Log form defines the holes to be displayed in the log, and the columns of information that make up the log.
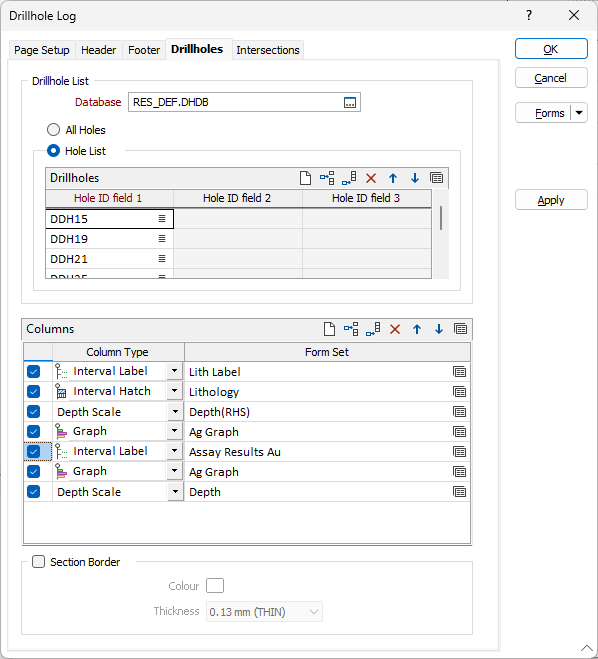
If “All Holes” is selected, the Drillhole Log function will cycle through all holes in the DHDB (using Next and Previous).
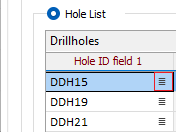
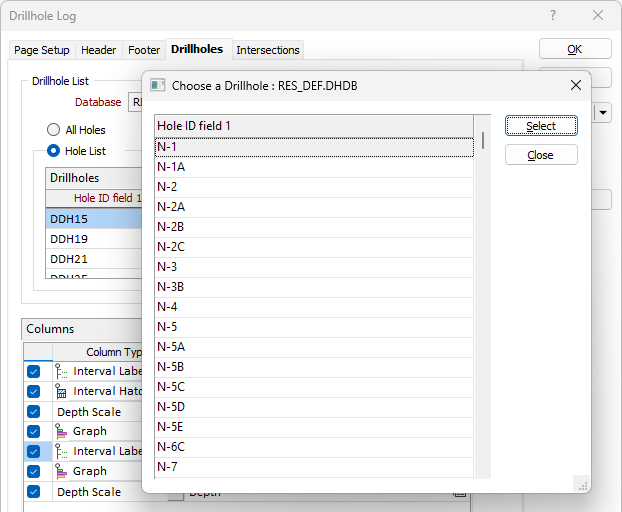
Defining a Hole List restricts the holes to be displayed by the DH Log function. To populate a hole list, click on the icon at the right of the response field to select a hole name:
Use the Shift and/or the Ctrl key to select multiple holes.
A hole list can be saved (as a form set):
Log Columns
The Columns grid defines the columns of drillhole information to be displayed in the log for each hole.
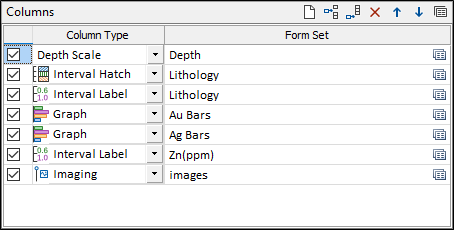
There are 6 different types of column:
- Interval Hatch
- Interval label
- Graph
- Depth Scale
- Event
- Imaging
A column is defined by selecting a type, defining the appropriate parameters for that type and then saving those parameters as a form set.
When you use this function for the first time, the grid list (defining the columns) will be empty.
Double clicking (or using the toolbar icon) will bring up the Drillhole Log form set manager. Initially there will not be any saved forms, so the first step is to define and save a form set.
In most cases the first tab will define the input file (from the DHDB) and how the data will be displayed (font, hatch, colour sets etc). Most of these parameters will be very similar to their Vizex equivalents.
The second tab defines the Column Properties. It will look like this:
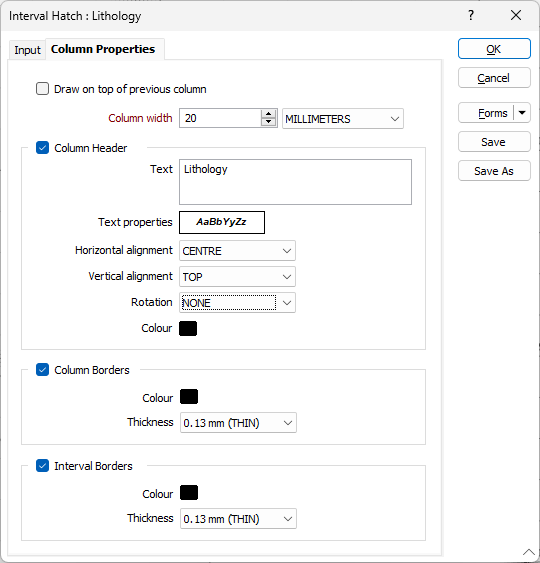
We will discuss the Draw on top of previous column option later.
The column width is defined here, but the position of this column, in relation to the other columns, is defined by the order of the columns in the grid list on the main form.
The Column Header refers to the text used to identify the column name.
So the vertical position and height of the Column Header is defined on the Header tab, but the title text for each column is defined as part of the column definition.
The “Column Borders” refers to the outer border of both the actual column and the column header.
The “Interval Borders” refer to the horizontal lines marking the start and finish of each interval. For hatching, this effectively become the hatch border, and for interval labels, this gives the column a table like appearance (each interval becomes a “cell” with a border).
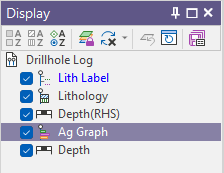
Interacting With the Log
The Drillhole Log window has its own Vizex Layer Display pane, Forms pane and Property window.
To edit items in the Main Header
Click on a frame to resize or move it. Double click to edit the parameters.
To edit parameters of the Log Columns
Double click anywhere in the column. Or double click on the “layer” in the Vizex Layer Display pane.
To change the order of the Columns
Use the mouse to click within a column, or within the header of a column, and drag to move the column to a new position in the log. A blue line will indicate the position into which the column will be inserted:

Drag the “layers” up or down in the Vizex Layer Display pane.
Alternatively, double click on the Drillhole Log heading in the Vizex Layer Display pane, to open the main form. Click on the Drillholes tab and use the Move icons in the Columns list.
To add a column using an existing saved form
Double click on the form set in the Forms pane (or select Display from the right-click menu).
Alternatively, double click on the Drillhole Log heading in the Vizex Layer Display pane, to open the main form. Click on the Drillholes tab and add, or insert, an item in the Columns group list.
To Zoom in or out
CTRL + mouse wheel. Or use the icons on the toolbar.
To Pan
Press mouse wheel and drag.
To overlay multiple columns
The two most likely scenarios are:
- To draw two (or more) line graphs.
- To write descriptive text inside a hatch pattern.
Select the Draw on top of previous column check box option. This forces the width to match that of the previous column (so the width parameter is now disabled).
In the example below, the Lithology Interval Label is now drawn on top of the previous (Lithology Hatch Interval) column. The Label is now horizontally centred. The text is formatted to have a fill colour. The column header for the Label has been turned off.
To View a different Hole
Use the Next or Previous buttons on the toolbar.
Click on the Hole Name dropdown (on the toolbar) and select the required hole.
To View Two Holes at the same time
For the moment you can open two independent Drillhole Log windows and display them side-by-side. (Right click on the Window tab and chose New Vertical Tab Group.)
Or print each as PDF and insert each into a separate Document plot frame in the Plot Editor.
Intersections
To calculate and display intersections:
Select the Calculate Intersections check box on the Intersections tab of the Drillhole Log form.
Specify an Interval file with one or more fields containing assay values. You can display values, graphs and a downhole reference scale, positioning these elements on the screen according to your requirements.
Use the Input Fields grid on the Intersections tab of the Drillhole Log form to select the names of the fields in the Intersection file that will be used to calculate the grade of intersections. The input fields you select must be numeric fields. The intersection calculation will calculate an average, weighted by the sample length (To field - From field) of these fields.
Calculating grade intersections is an interactive process which is done in the display:
-
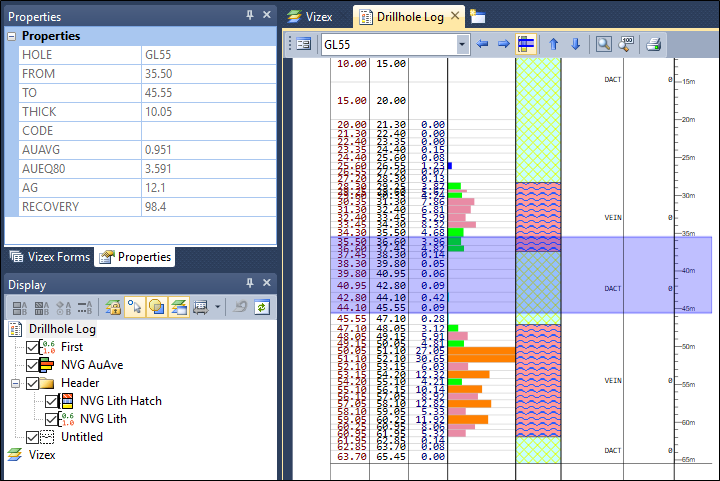
- Use the mouse to click on a Start interval:
- When you move the mouse after clicking on the first point, a shaded selection box is displayed as you use the mouse to move the cursor bar up or down the log.
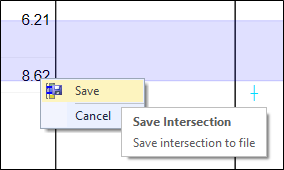
- A second mouse click creates the intersection and the weighted average of the intersection fields (grade fields), the thickness of the intersection, and the From and To intervals are displayed in the Properties window:
![]()
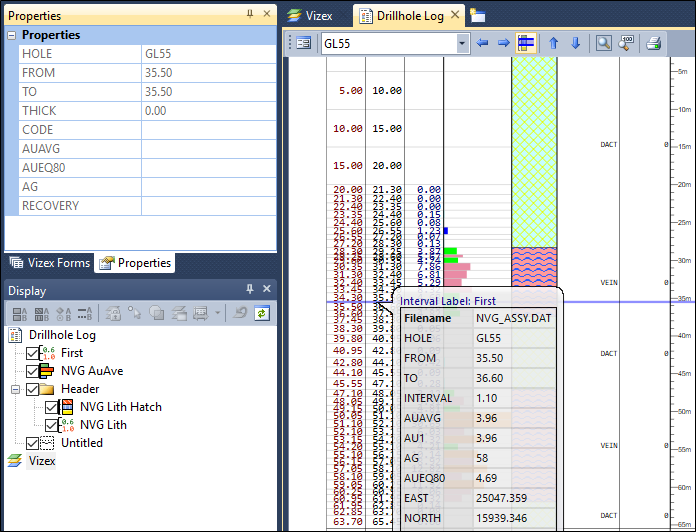
The cursor bars automatically snap to sample boundaries. It is not possible to have an intersection representing a partial sample interval. The second cursor bar can be located above the first cursor bar without affecting the validity of the calculation.
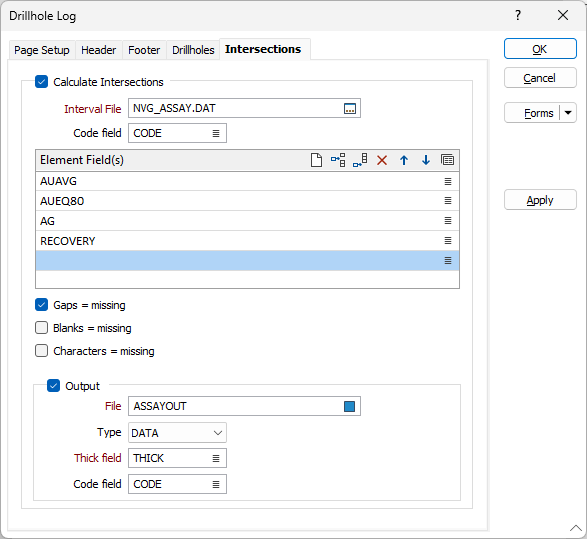
Intersection calculation fields are setup on the Intersections tab of the Drillhole Log form.
![]()
If you defined a Code field, you will be prompted for a Code value.
Displaying Intersections
The Intersection output file can be the Input file for another column. As new intersections are created (interactively), and saved, the column showing the intersection results is automatically updated.
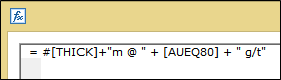
Combine this with the use of the expression builder and you can generate output like this:
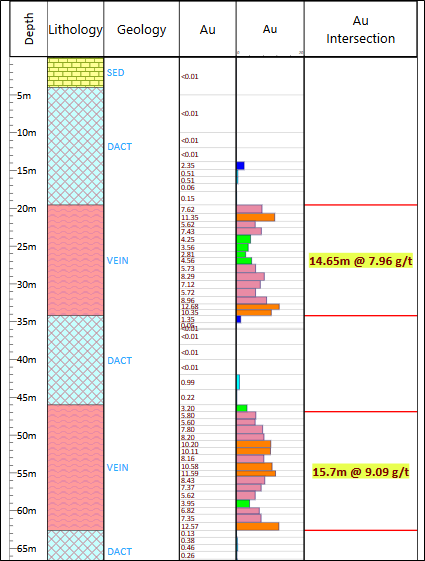
Where the field displayed in the Au Intersection column looks like this: