Display Stratigraphy
A Stratigraphy file is a compiled file that is used to interpolate and display the stratification of the seams in a Seam file.
![]()
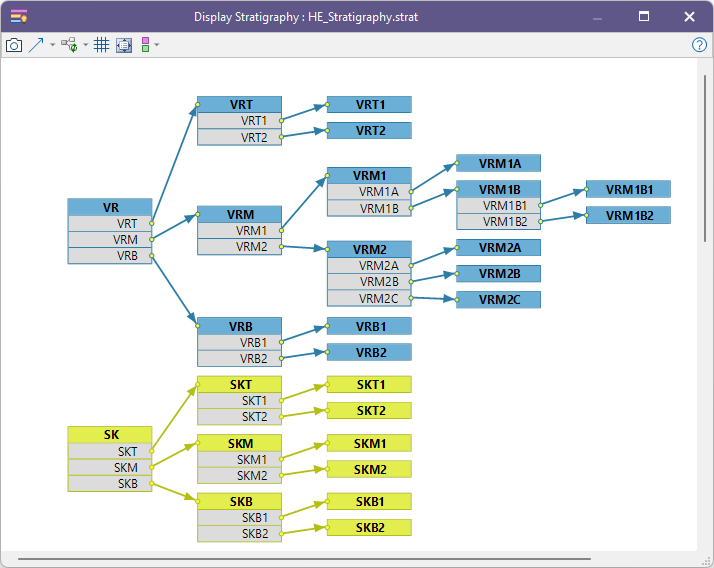
To display stratigraphy, navigate to the location of a compiled Stratigraphic Sequence (*.strat) file generated by the Generate Stratigraphy function. If Percentage values have been defined for the child seams, they will be shown in the Stratigraphy diagram.
The following tools are available on the toolbar of the Display Stratigraphy window:
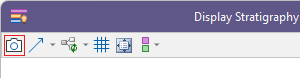
- The Stratigraphic Sequence can be saved to a PNG (Portable Network Graphics) Image file:
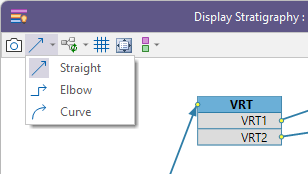
- Use the Connections tool button menu to select a Straight (the default), Elbow, or Curve style for the connectors in the Display window.
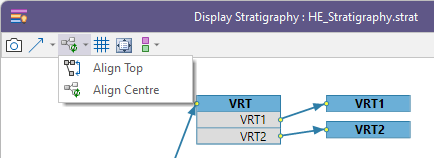
- Use the Arrange tool button to align each parent node to the Centre or the Top of its group. In the example diagram (above), a Centre alignment is shown.
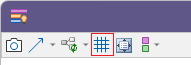
- Items can be dragged to different locations using a background Grid as a guide:
- A Fit to Window button can be used to fit the Stratigraphic Sequence to the Display window:
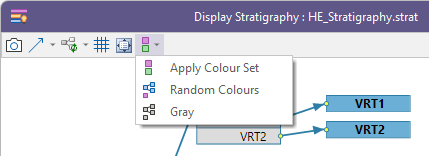
- By default, Random Colours are applied to the disjoint sets in the sequence. Use the Colour Set menu to Apply Colour Set to colour-code the Stratigraphy Sequence by Seam Name. Alternatively, you can select Gray to use a greyscale colour scheme, or select the default Random Colours: