Points
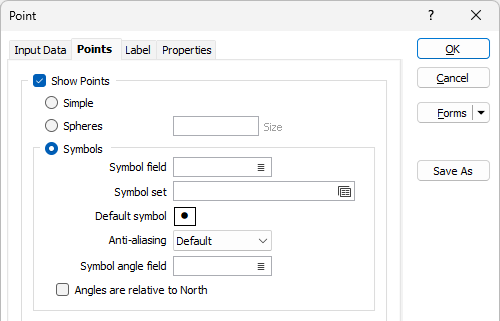
On the Points tab of the Display Points form you can specify whether to display points and, if so, how to display them.
Show Points
Select this option if you want to display the points (you may prefer not to display them by default).
See Also: Object Visibility for Points
Simple
If the Simple option is selected, the points will be rendered as simple OpenGL points. Simple OpenGL points are a lot faster to draw than symbols and may be preferred when loading a large dataset.
Spheres
Select the Spheres option to display the point or hole information as a 3D sphere of the selected colour. Symbol options will be disabled. Enter a Size for the sphere or leave the default.
Symbols
Select the Symbols option to enable the display of point or hole information as a selected symbol.
Symbol field
Specify the name of
Symbol set
Double click (F3) to select the set that will be used to determine the symbol that will be displayed. The symbol set maps symbols to text strings or numeric ranges. This determines a symbol for each value in the chosen (mapped)
Default Symbol
Double-click in the Default Symbol box to select the symbol to be used when a Symbol
Double-click the Symbol icon to choose a symbol. You can source symbols from any TrueType or OpenType font.
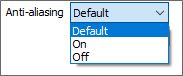
Anti-aliasing
Anti-aliasing can be turned on to smooth the symbols to produce perfectly round edges. However, you may prefer to turn off anti-aliasing for some point layers. Dense point clouds, for example, may appear "noisy" due to the anti-aliased edges of the points.
Default matches the current (On/Off) state of the Symbol anti-aliasing check box on the Vizex tab of the the Options | System | System Options form.
Symbol angle field
Enter the name of the field containing symbol angle values (0-360°). A value of 0 will display the symbol in its natural orientation. A value of 90 will display the symbol rotated 90° in the clockwise direction, and so on.
Angles are relative to North
Select this option so that the angle of the point symbols will always be relative to North (rather than relative to the screen plane) when you rotate the screen.
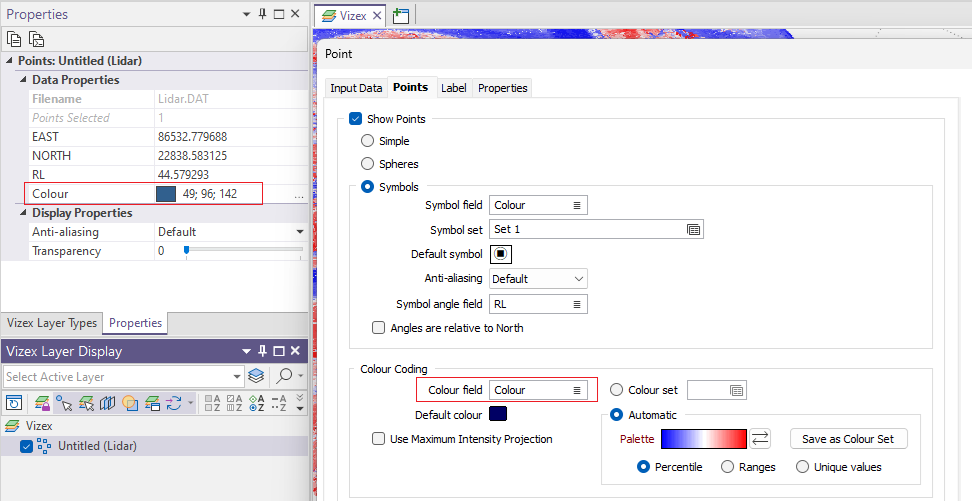
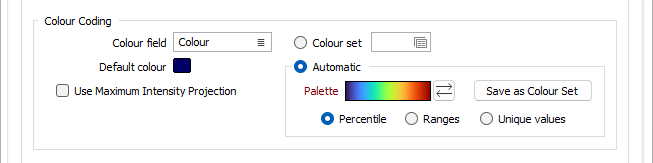
Colour Coding
When strings or points are added to a new layer, a Colour field is added to the Data Properties and is auto-populated with a default colour (initially NULL) that can be quickly changed alongside other properties in the Vizex Property Pane.
Colour field
Specify the name of a field which contains the values that will be used to colour-code the display. If you are mapping Colour field values to a Colour Set, the values in the Colour field must be valid RGB, HTML Hex, Hex, or Integer colour definitions.
| Format | Example | |
|---|---|---|
| RGB | 89,169,215 | RGB ordered |
| HTML Hex | #59A9D7 | BGR ordered |
| Hex | 0x59a9d7 | BGR ordered |
| Int | 5876183 | BGR ordered: RED + (GREEN*256) + (BLUE*65536) |
You can choose to select colour values directly from the Colour field without selecting a Colour set. In this case, you can also select a formatted Colour field.
An RGB(r,g,b) function which lets you calculate RGB colour values on the fly, for example when loading points, can be included in a Dynamic Field Expression. See: Expression Editor
You can view and edit the RGB values assigned to the Colour field in the Property Window. Click on the ellipsis to open the Colour picker:
Default colour
Double-click (F3) to select the colour that will be used when a Colour field or a Colour set is not defined - or when a value in the Colour field is either not valid or is not mapped in the Colour set.
Colour set
To map values in the Colour field to the colour values in a Colour set, double click (F3) to select the set that will be used to control the display colour. Right-click (F4) to create or edit a Colour set.
Use Maximum Intensity Projection (MIP)
Select this option to use Maximum Intensity Projection (MIP) to highlight points of interest.
Automatic
Select Automatic to select a palette and automatically apply colour ranges to the data. The Save As Colour Set button provides the option to save the result as a colour set.
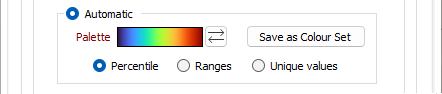
Choose a mode of calculation:
| Mode | Description |
|---|---|
| Percentile | The application will divide the data into ranges each containing the same number of values; the highest and lowest value in each bin will define the upper and lower values for each range. |
| Ranges | The data will be divided into equal ranges. |
| Unique values | A colour will be assigned to each unique value. |
Normally, when there are overlapping symbols in a point display, closer points will hide points that are further away. However, when the Use Maximum Intensity Projection (MIP) method is enabled, the highest values are always displayed on top of progressively lower values. Even if the Colour field is a character field the same principle applies. Point ‘Z’ will display above point ‘A’. This ordering is maintained irrespective of changes to the view orientation, making it easier to visualise trends in masses of point data.
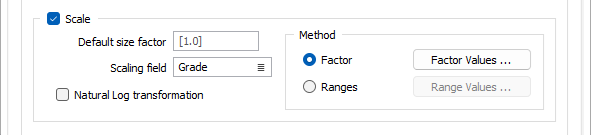
Scale
Select the Scale check box to scale the symbols using a Scaling field:
Default size factor
Enter the multiplier that will be used to size all the symbols. They can be made smaller by entering a decimal number less than 1. For example, 0.5 will halve their size. To increase the size, enter a number greater than 1
Scaling field
Select the field that contains the values to be used when scaling is applied. The Use Symbols option must be selected in order for the displayed points to be scaled.
Natural log transform
Optionally, set the Symbol Display Mode to Natural Log Transform.
Method
The Scaling method governs how the size of the symbol drawn at each point is determined. The radius is measured in the same units as the grid coordinates.
- The Factor method calculates a radius proportional to the
value in the Scaling
- The Range method uses a series of ranges defined in a table. The function checks
to see which range contains the value in the Scaling
Select either Factor or Ranges, click on the associated button and enter the required values.
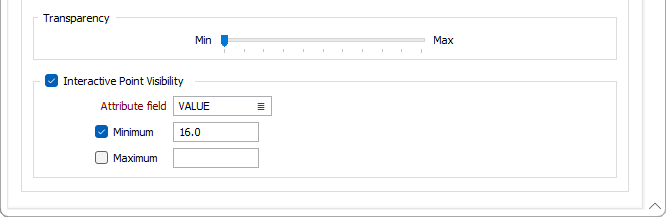
Transparency
Use the transparency slider to specify the intensity of the display layer. The visibility of the layers underneath the current display layer will be determined by the degree of transparency you select.
Interactive Point Visibility
The Interactive Point Visibility option makes it easy to show or hide points based on numeric values in the file. When this option is enabled a histogram shows the distribution of those values; you then adjust the visibility of points by moving sliders along the histogram.