Pie Charts
Points can be displayed as simple shapes, or as scaled symbols. You can also display them in pie chart format. Typical uses are for the display of geochemical plots and block model values.
![]()
The input data required to display a pie chart is the same as that required when loading point data. See: Input Data

Use the Display tab to set display options that determine how point values will be displayed in a pie chart.
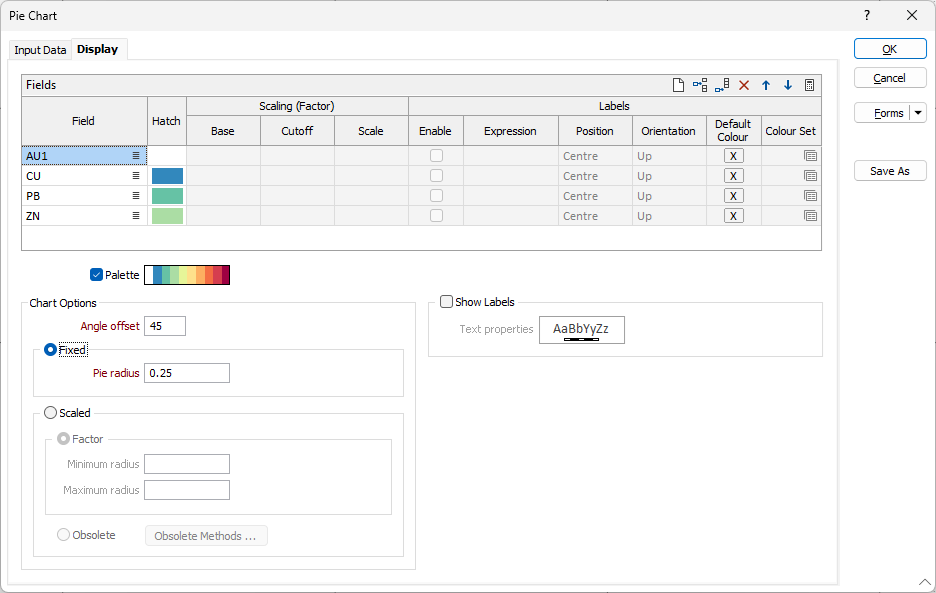
Fields
Enter (or double-click to select) the name of each field whose value you want to represent as a pie segment. Use the buttons on the local toolbar to Manage the rows in the list.
|
|
Click the Auto Calculate button to fill the fields listed in the grid with default colours. The colours are shuffled each time you click this button. |

Hatch
Optionally, double-click on the Hatch buttons to select fill patterns for each segment.
Scaling (Factor)
The following inputs are enabled when the Scaled > Factor scaling method has been selected:
|
Method |
Description |
|---|---|
|
Base |
Enter a Base Value below which no segment will be shown. |
|
Cutoff |
Enter a Cutoff Value. Any value greater that the cutoff will be shown at this size. |
|
Scale |
Enter a Scaling Factor to be used to multiply the field value. If you have specified a Base value, it will be subtracted before the multiplication occurs. Negative values are treated as zero. |
Labels
Set the following options to show labels, on the segments of the pie chart, for the fields you have specified in the grid:
Enable
Select the check boxes to enable individual labels.
|
|
Click the Clear button to clear the settings in all rows. |
Expression
Most of the time you won't need to use an expression and the label value will be the value of the field you have chosen for that segment. For more complex annotations, click the [fx] button to display the Expression Editor. See: Expression Editor
Position
Choose how the labels will be positioned:
|
Option |
Description |
|---|---|
|
Centre |
At the centre of each segment |
|
Inner Edge |
Offset within the inner edge of each segment. |
|
Outer Edge |
Offset beyond the outer edge of each segment. |
Orientation
Choose how the labels will be orientated:
|
Option |
Description |
|---|---|
|
Up |
Orientate the labels so that the top of the labels are aligned with the top of the screen. |
|
Parallel |
Orientate the labels so they are parallel to the axis of the segment. |
|
Perpendicular |
Orientate the labels so they are perpendicular to the axis of the segment. |
Default colour
Double-click (F3) to select the colour that will be used when a Colour field or a Colour set is not defined - or when a value in the Colour field is either not valid or is not mapped in the Colour set.
Colour set
To map values in the Colour field to the colour values in a Colour set, double click (F3) to select the set that will be used to control the display colour. Right-click (F4) to create or edit a Colour set.
Palette
Select the Palette check box to use the colours defined in a Micromine palette.
Chart Options
Angle offset
The angle from which the first slice starts. The default reference angle is 90° clockwise (0° is straight up). This value can be used to rotate the pie chart.
You can change the order of the slices in the Fields grid list (see above).
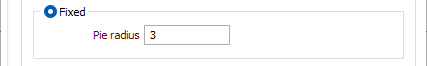
Fixed
Select this option to define a fixed-size pie (with a size defined by its radius) that is divided into variable slices.
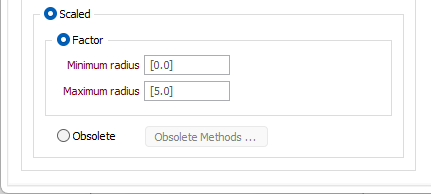
Scaled: Factor
Select this option to linearly scale the pie slices based on the minimum and maximum radii input values. Base, Cutoff and Scale input values you have entered for each segment defined in the Fields grid list (see above).
You must enter a Minimum radius value to set a limit on the size of the segments that can be displayed. If the actual radius is less than this Minimum radius, the Minimum radius is used.
(Optional) You can also set an upper limit on the size of the segments by specifying a Maximum radius value. If the actual radius is greater than this Maximum radius, the Maximum radius is used.
The Minimum radius can be set to be greater than the Maximum radius, allowing for a pie chart where the larger the value, the smaller the radius.
A different scaling factor is calculated and applied to each pie segment. When you select the Normalised scaling method, on the tab, the same scaling factor is applied to all segments.
Scaled: Obsolete
Alternatively, select this option to specify how the pies will be scaled using . These methods are provided to ensure that existing form sets are backward compatible.
Forms
Click the Forms button to select and open a saved form set, or if a form set has been loaded, save the current form set.
By design, the Forms button is not available for loaded Vizex layers (i.e. when opening the form set properties of a layer in the Vizex Layer Display pane). In Vizex, the Forms button is only available for new forms opened via the Home tab or the Vizex tab, in the Layer group (or by double-clicking on a form type node in the Vizex Layer Types pane).
Save and Save As
Click the Save button to save the changes you have made to the form set. Click Save As to save your changes as a new form set. Save As will default to the first available form set number.
Reset
Click Reset to clear the form of all values and reset the form to its default state.
Reset Tab
For tabbed forms, select Reset Tab to clear the active tab of all values and reset the tab to its default state - without making any changes to other tabs in the dialog.
Undo and Redo
Click Undo (CTRL + Z) to undo recent changes in the form. After an Undo, click Redo (CTRL + Y) to restore the last change that was undone.
Collapse
Collapse (roll-up) the form to preview a chart, or preview the results of an operation in Vizex, or obtain input values from Vizex, the Property Window, the File Editor, or the Plot Editor.