Display
Use the Display tab of the Grid Surface form to set the appearance of the Grid Surface.
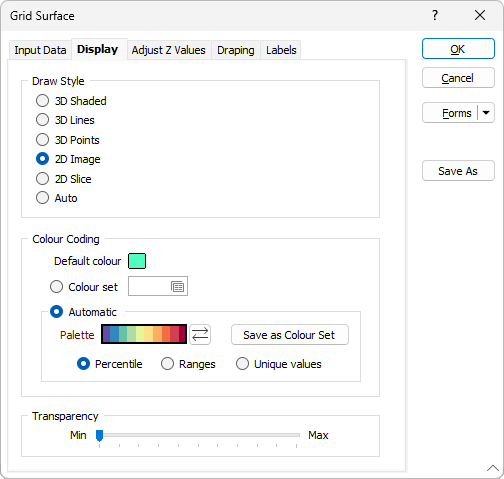
Draw Style
Select a Grid Surface Draw Style:
| Style | Description |
|---|---|
| 3D Shaded | This draw style cannot be plotted. When plotted, it is drawn as 3D lines. |
| 3D Lines | Select this option to view the grid surface as 3D lines. |
| 3D Points | Select this option to view the grid surface as 3D points. |
| 2D Image | Select this option to view the grid surface as a flat 2D projection. |
| 2D Slice | This draw style will generally use the least memory and be the quickest to draw. |
| When you select the 2D Slice draw style, a cross-section through the objects in the current layer is displayed in the plane of the current view - or the orthogonal plane that is closest to the plane of the current view. If, however,the current view is a transform section, then the actual plane of the view will be shown. | |
| When 2D Slice is selected the hatch icon is enabled, allowing a hatch or fill pattern to be applied to the cross-section. | |
| Auto |
When the Auto option is selected, a 2D Slice draw style is applied when the current view is clipped. Otherwise, a 3D Shaded (Hollow) draw style is applied. |
Default Colour
Select a different default colour by double-clicking (using the left mouse button) on the Default colour box. This is used if you do not define a colour set.
Colour Set
Colour code the display by selecting an existing colour set or by defining a new one. Colours are assigned to each cell or pixel according to their value. Although this method is most applicable to grids it may also be used on images if necessary.
Colour sets are one of the most important ways of making it easy to differentiate between values, regions and other objects in the display. The tools you use to create colour sets are particularly powerful. Because colour sets are saved as form sets they can be used anywhere in a project and can even be exported to other projects.
To create a new colour set, right-click in the Colour set box to open the Numeric colour set dialog box. Here you can define a numeric colour set to control the colouring of the contour grid. The Assign and Calculate functions work for (binary) Grid Surface files. After you click Assign, make sure you select GRID as the file type. The Value prompt will be disabled and the cell values will be used for the ranges.
Automatic
Select Automatic to select a palette and automatically apply colour ranges to the data. The Save As Colour Set button provides the option to save the result as a colour set.
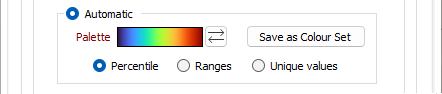
Choose a mode of calculation:
| Mode | Description |
|---|---|
| Percentile | The application will divide the data into ranges each containing the same number of values; the highest and lowest value in each bin will define the upper and lower values for each range. |
| Ranges | The data will be divided into equal ranges. |
| Unique values | A colour will be assigned to each unique value. |
Transparency
Use the transparency slider (0 - 100%) to specify the intensity of the surface. Whether the layers displayed below the grid surface are visible, will depend upon the degree of transparency you select.