Table Frame
A Table frame can be used to display the data extracted from a file or database in tabular format. This type of frame is often used to display a grade estimate report or similar information pertaining to the main subject of the plot. Another common application is to display a list of drillholes with their corresponding coordinates.
To alter the appearance of the table, a number of table font and line styles can be applied.
To add a new Table frame:
- Double-click on the Table frame type in the Plot Forms pane.
- Set the following parameters on the Source tab:
- Right-click (F3) in the File response to open the file.
- Position the highlight in the first of the fields you want to hide.
- Select Format | Hide Fields or press Ctrl+H.
- Repeat this process for all the fields you want to hide.
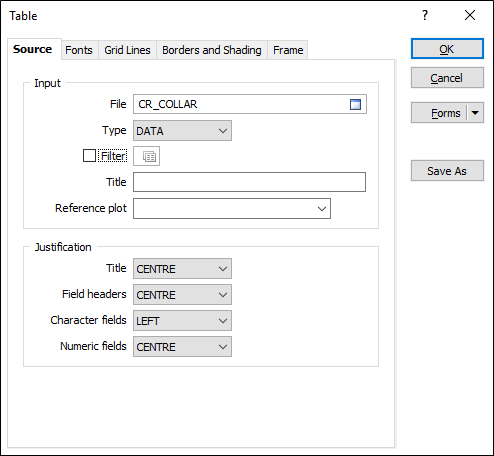
File
Select a file type and then double-click (F4) in the File input box to select the data that will used to populate the table.
The contents of a table frame can be a data, survey or string file, or a file defined as an ODBC or MDB link.
Filter
You can control which records are displayed using a filter. It is also possible to limit which fields are displayed by opening the file. To do this:
If you want to display the contents of a Report file on a plot you will need to convert it to a data file in File | Conversions.
Title
Enter a short title for the table.
Reference plot
In Ring Design a specific type of plot, with its own table name substitutions is generated. If there are multiple Ring plot frames in your layout, you may need to define which plot frame the substitutions come from.
By default, predefined ring table substitutions are taken from the largest plot frame in the layout (when the Reference plot box is left blank).
Justification
The (Title, Field Header and Field Value) text displayed in the table frame can be Centred, Right justified, or Left justified. In general, NUMERIC fields are right justified and CHARACTER fields are left justified.
- On the Fonts tab, set the fonts that will be applied to the Title, Headings and Data of the table.
- On the Grid Lines tab, select the Vertical and Horizontal check boxes to set the line styles that will be applied to the vertical and horizontal lines of the table.
- On the Borders and Shading tab, select the check boxes to set the line styles that will be applied to the underline header and table border. Select the colours that will be used to shade the rows and columns of the table.
- Set the fill, border, and margin properties of the frame in the Frame tab.
- Finally, click OK to add the Table frame to the layout.
Another way to add a new frame to the layout is to use the New Frame tool on the Plot Editor toolbar. Click and drag the mouse in the layout window to define the size and position of the frame. When you release the mouse button, you will be prompted to select the frame type.