Scale Bar Frame
A scale bar is a line or bar, divided into parts, and is used to represent the scale of a map. To add a new Scale Bar frame:
- Double-click on the Scale Bar frame type in the Plot Forms pane.
- On the Scale Bar tab, set the properties of the scale bar:
Scale
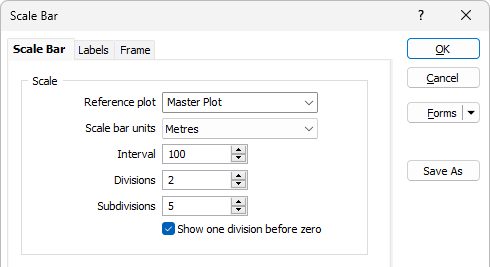
Reference Plot
Select a plot frame as a reference frame that will be used to determine the scale of the plot.
Plot units
Select the plot units from the drop-down list box. A wide selection of metric and imperial measurement units are available to choose from. If the units are unknown, you can also select an Unknown Units option.
Scale bar units
Select the scale bar units from the drop-down list box. A wide selection of metric and imperial measurement units are available to choose from. If the units are unknown, you can also select an Unknown Units option.
Interval
Use the increment and decrement buttons to set the number of intervals that will be displayed along the scale bar.
Divisons and Subdivisions
Use the increment and decrement buttons to specify how each interval will be subdivided. If you have chosen one of the alternating scale bar styles, the effect of your settings will be visible in the Preview pane.
When a spin control has focus, you can use the mouse wheel to increase or decrease the displayed value.
Show one division before zero
Select this option if you want to display a division of the scale bar before zero. This option is often used to in conjunction with the FIRST SUBDIVISION labelling option to show labelled subdivisions in the division before zero.
Format
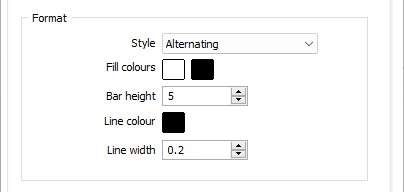
Style
Select the style of the scale bar.
|
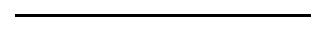
Line |
|
|
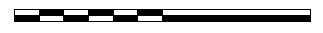
Alternating |
|
|
Double Alternating |
|

Fill Colours
Double-click on the colour icons to select the fill colours that will be applied to the scale bar. If the chosen scale bar style is not an alternating one, then the alternate (second) colour will not be used.
Bar height
Use the increment and decrement buttons to set the height of the scale bar. To display ticks, refer to the options on the Labels tab.
Line Colour
If you want to display a line around the edge of the scale bar, double-click on the colour icon to set the colour of the line.
Line Width
If you have selected a line colour, specify the width of the line that will be drawn around the edge of the scale bar.
- Set the appearance of the labels and tic marks of the scale bar in the Labels tab.
- Set the border and margin properties of the frame in the Frame tab.
- Finally, click OK to add the Scale Bar frame to the layout.
Another way to add a new frame to the layout is to use the New Frame tool on the Plot Editor toolbar. Click and drag the mouse in the layout window to define the size and position of the frame. When you release the mouse button, you will be prompted to select the frame type.