Tracking Stockpile Quantities & Qualities
There are several means of tracking both the material going to and coming off stockpiles. The Stockpiles section in the application provides detailed reports of material on the stockpile over the course of the schedule. Pivot Tables and Spreadsheets section can be used to track material going to and coming off the stockpile.
Conceptual Information
The link created between the source and the destination records of the stockpile allows the application to hold on to the data of the source record. When that material is recovered from the stockpile, the application can track the associated data as long as the link still exists. The key to maintaining that link is through the Custom Fields, which are the basis of all stockpile reporting. Of particular importance is the Filter Expression.
Custom Fields
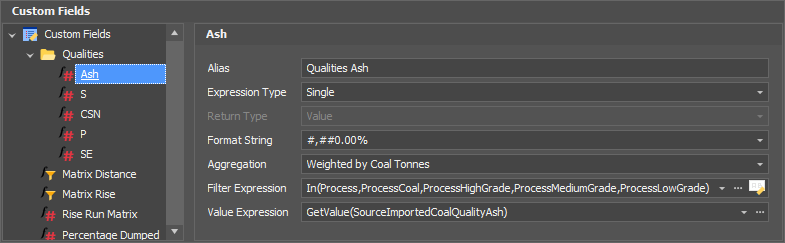
If you do not already have custom fields set up that report coal qualities, use the example below as a guide.
The key to reporting quantities and qualities coming off your stockpiles is to set up your Filter Expressions correctly.
You will need to set up a filter that includes both the process that delivered material to the stockpile and the process that removes material from the stockpile.
Note: Technically you can set up a blank filter to achieve the same effect, but this is not recommended.
If you do not include the process that delivered you will not get results via any reporting method, including pivots, stockpile tracking and spreadsheets.
If you do not include the process that removes you will get limited results. You will still be able to track the qualities of material added to the stockpile as well as the aggregate value of the stockpile. However you will not be able to track the qualities of material that is removed from the stockpile using pivots, spreadsheets or the output schedule.
In the example below, the filter was originally limited to just the Coal process. It has been modified to also include the three new processes that perform stockpile reclamation.
Process=ProcessCoal
BECOMES
In(Process,ProcessCoal,ProcessHighGrade,ProcessMediumGrade,ProcessLowGrade)
Stockpile Tracking
Click on the Stockpiles button (located with the rest of the reporting options).
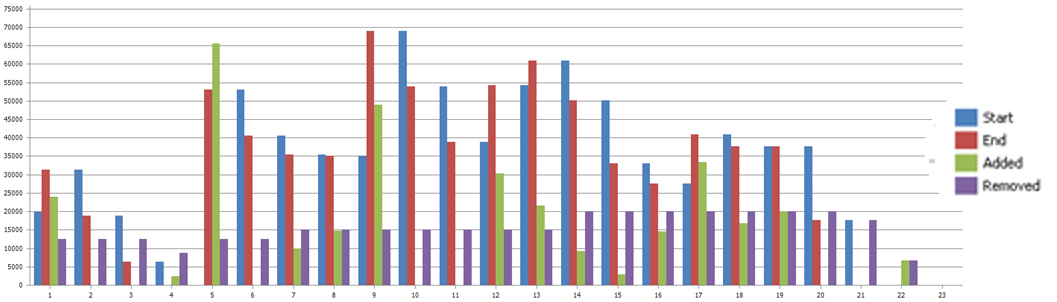
On the left hand side, select which stockpiles you want to represent as a line graph. You can select multiple stockpiles though it may be hard to distinguish between them, particularly as you add more custom fields to the report.
![]()
On the right hand side, select which custom fields you want represented in the graph. Place your mouse over the graph and you will see a purple, vertical line. Place this line at any point on the graph to get a readout of each field, per stockpile selected.
Note, gaps in a line are an indicator that there is no material on the stockpile at that point in time.
![]()
Other options include the Chart Type, where you can select between "Timeline" (pictured above) and "At Reporting Period". This second option lets you pick from your existing Reporting Periods and examine the status of the stockpiles selected at either the start or end of that period.
![]()
![]()
Spreadsheets
Click the link below if you are unfamiliar with application-specific spreadsheet formulas:
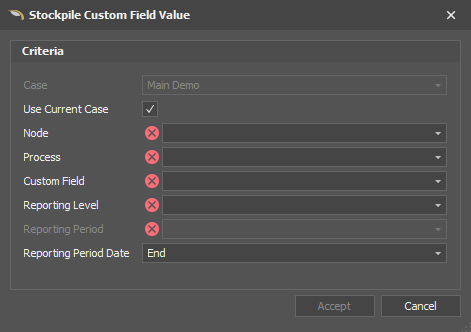
In the application's spreadsheets, Stockpiles have their own inbuilt formula: STOCKPILECUSTOMFIELDVALUE
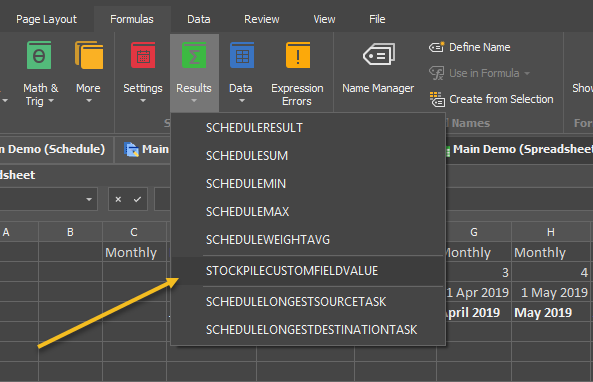
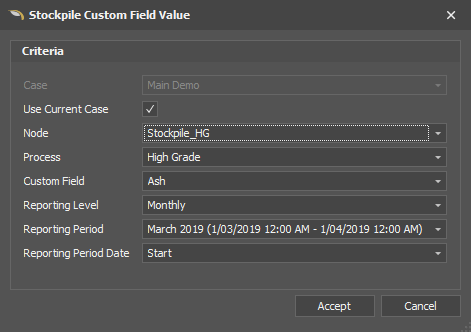
Click on this option to bring up the formula wizard. Input all the requisite filters so that no red X's remain.
Note that for the Node input you can select a parent node (i.e. a node that contains other nodes), so that if your stockpile is made up of several nodes you can group them together.
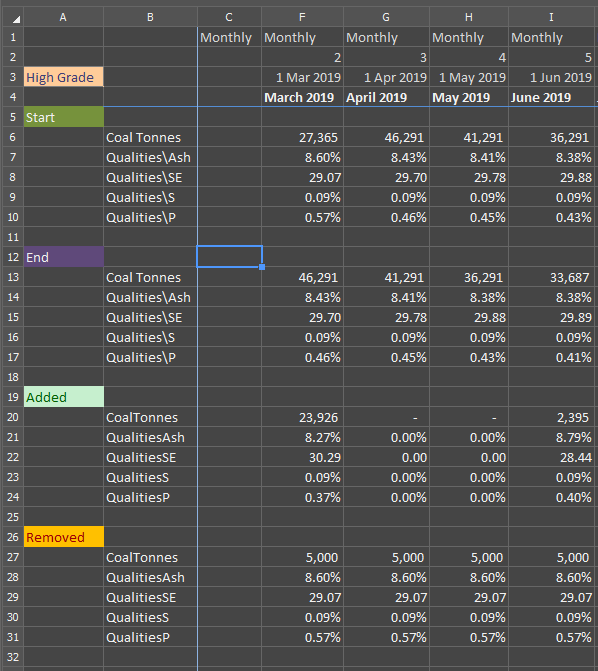
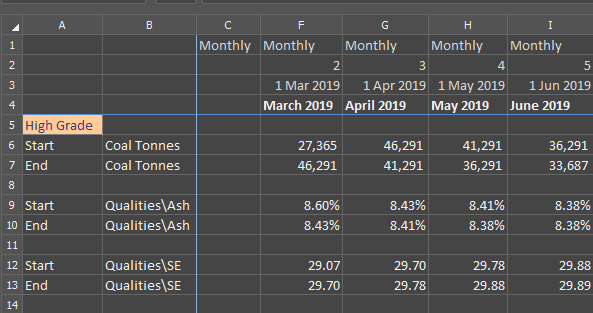
Using cell references you can quickly build up a simple report detailing the quantity and qualities of your stockpiles at the start and end of each reporting period.
You can track how much has been added to and removed from the stockpile using standard application spreadsheet formulas with the appropriate filters.
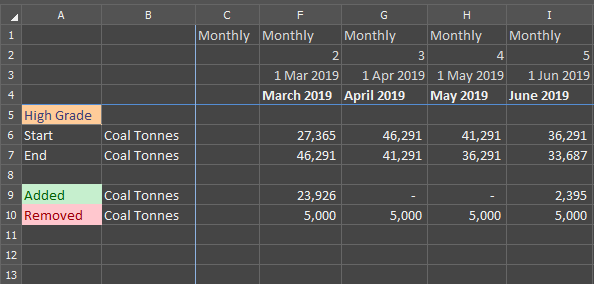
With a bit of effort you can create a comprehensive spreadsheet detailing the quantities and qualities going to, coming from and remaining on your stockpiles.