Grid Frame
You can add one or more grids to a plot. Each grid is used to reference local coordinates or the coordinates of a map projection.
When you setup a Vizex plot, the plot layout (PEX) file is automatically updated to reference additional grids displayed in Vizex.
A typical use for an additional grid is to overlay a local project grid onto UTM coordinates, with the local grid oriented to local north and limited to the project extent. Each additional grid has independent options for setting the area of coverage, the appearance of lines and labels, and optionally defining a plane grid coordinate transformation.
You can load a predefined grid, or grids, from the Plot Forms pane. The options you are most likely to need for a particular type of layout, are provided as predefined frame form sets. See: Load a predefined frame
To add a grid to a parent plot frame:
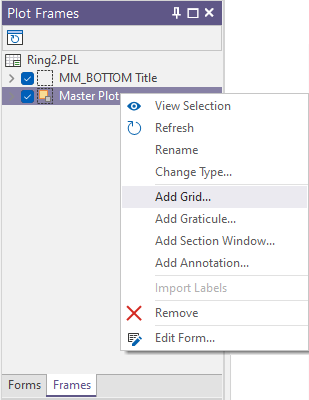
- Select the parent plot frame in the layout window or the Plot Frames pane.
- Right-click on the plot frame (in the layout window or the Frames pane) and select Add Grid. Alternatively, double-click on the Grid form set type in the Plot Forms pane.
- Set the following parameters on the Lines tab of the grid form:
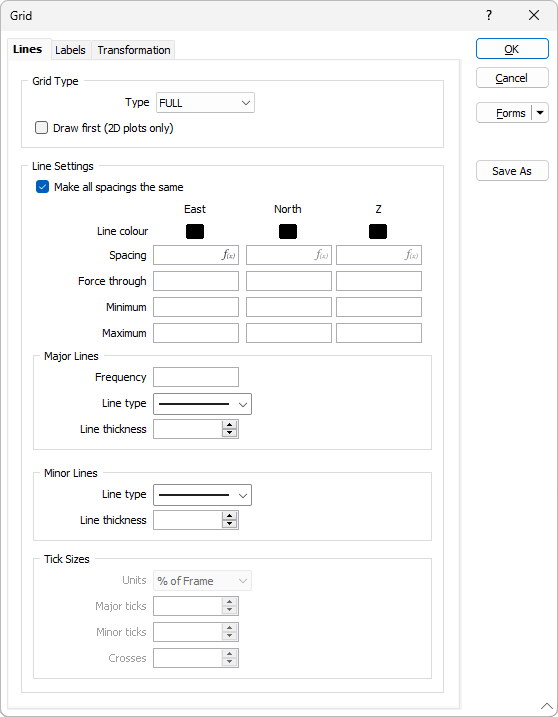
Lines
Grid Type
Select the type of grid to display:
- FULL draws lines from one side of the paper to the other.
- CROSSES draws tic marks around the plot border and crosses wherever grid lines intersect.
- TICKS draws tick marks around the plot border.
Draw first (2D Plots only)
In some cases grid lines may obscure the data. Select the Draw first option to ensure that the plot data is always drawn on top.
This option only applies to a 2D plot and does not apply to a Vizex plot. Since a background is part of the Vizex plot data, if a grid is drawn first it will be completely obscured by the background.
Line Settings
Enter a Spacing for the lines drawn along the East, North and Z axes.
Alternatively, select the Make all spacings the same check box to apply a single spacing to all axes of the grid. Enter the spacing in the East spacing box. The North and Z spacing boxes are disabled when this check box is selected.
Double-click on the Colour icons to select a colour for the labels along each axis.
Sometimes it is necessary to force the grid lines through a particular coordinate on a plot.
For example, a grid with a 20m spacing will, by default, be running through 100m, 120m and 140m. You may require the grid to pass through 90m, 110m and 130m. In this case, enter one of these values and the grid lines will be adjusted automatically.
Minimum and Maximum Extents
Optionally specify the minimum and maximum extents of the grid.
Major Lines
A grid is typically made up of a series of Major and Minor lines which can be differentiated by their line style and thickness.
- Enter the Frequency with which major lines will be drawn along each axis. For example if you enter 5, every fifth line will be a major line, while all other lines will be minor.
- Select a Line style from the drop-down list of (SOLID, DASH, DOT, DASH DOT, DASH 2 DOTS) line style options.
- Select a Line thickness from the drop-down list of (THIN, MEDIUM, THICK) line thickness options.
Minor Lines
- Select a Line type from the drop-down list of (SOLID, DASH, DOT, DASH DOT, DASH 2 DOTS) line style options.
- Enter a Line thickness value (in points).
When a spin control has focus, you can use the mouse wheel to increase or decrease the displayed value.
- Set Labels on the Labels tab of the form.
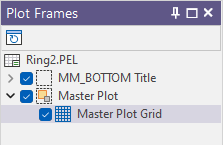
- Click OK to add the Grid as a child of the selected plot frame.
In the case of a grid or a graticule there are no common (fill, border, and margin) frame properties to specify, since the grid or graticule is added as a child frame of the parent plot frame and automatically fills the extents of the parent plot frame.
You can only select a grid or a graticule in the Plot Frames pane.
Tick Sizes
If you have chosen TICKS as the grid type, set the Units of measurement and the size of the Major ticks and Minor ticks.
If you have chosen CROSSES as the grid type, set the size of the Crosses.