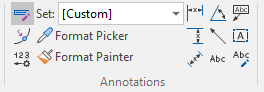
Annotations
Use the tools provided on the Plot Editor ribbon in the Annotation group, to add Text, Callout Text and Text Box objects, dimension lines and arrows to the plot.
|
|
Click Edit labels to put the plot into Edit Labels mode and enable the tools in the Annotation group. |
|
|
Click the Snap to Point button to toggle Snap to Point mode on and off. When Snap mode is turned on, the mouse cursor will snap to the nearest point. |
|
|
To set Labelling options, click the Edit Annotation Sets button. |
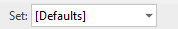
| The Active Options combo box on the Annotation toolbar indicates the current working set. Selecting [Defaults] will reset everything to reasonable system defaults. | |
|
|
|
|
Use the Format Picker tool to pick up (arrowhead, colour, line width, angle units etc.) format settings from an existing annotation object. |
|
|
Use the Format Painter tool to apply the current format settings to selected annotation objects. |
|
|
Click the Horizontal Dimension Line tool to add a horizontal dimension line to the plot that measures the horizontal distance between any two points (along the x-axis). |
|
|
Click the Vertical Dimension Line tool to add a vertical dimension line to the plot that measures the vertical distance between any two points (along the y-axis). |
|
|
Click the General Dimension Line tool to add a dimension line to the plot that measures the length of diagonal line segments. |
|
|
Click the Measure Angle tool to add an Angle measurement to the plot. |
|
|
Click the Arrow tool to add an Arrow line to the plot. |
|
|
Click the Text tool to add a Text label to the plot. |
|
|
Click the Text Callout tool to add a Text Callout label to the plot. |

|
Click the Text Box tool to add a Text Box label to the plot. |
|
|
Click the Edit Text button to edit the selected Text or Callout Text label. |