Plot Annotations
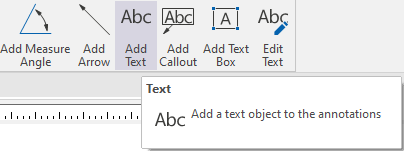
In the Plot Editor you can add annotations directly into a plot, providing access to labels, arrows, dimension lines, text and callouts. This makes it much more convenient to mark-up a plot layout.
You can also superimpose labels onto the hatch patterns in a legend
To add annotations to a plot layout:
- Select Plot | Open to display the layout in the Plot Editor.
- Select a plot frame by clicking anywhere within it.
- Enable annotation mode by clicking the Edit Labels button on the Plot Editor ribbon in the Annotation group:
- Choose an option in the Annotation group and then follow the instructions on the Selection Assistant.
![]()

Superimpose labels onto hatch patterns
You can superimpose labels over hatches in a plot legend, producing richer legends by labelling the hatch patterns. Because this is a manual process you would only use it to highlight selected hatches for clarity, rather than applying it to the entire legend. A typical scenario might be to display the underlying code value of certain hatch patterns in a geological legend.
To add labels to hatches in a plot legend:
- Select Plot | Open to display the layout in the Plot Editor.
- Double-click a legend frame to display the Legend dialog.
- Double-click an individual hatch pattern and enter a Label value.
To control the appearance of the labels:
- Switch to the Layout tab on the Legend dialog, and
- Change the Label font style and colour,
or
- In the Plot Editor, click the legend frame to select it, and
- Change the Label font style and colour from the Properties window.
You can also add an Annotation Frame to a plot layout.