Indicator
![]()
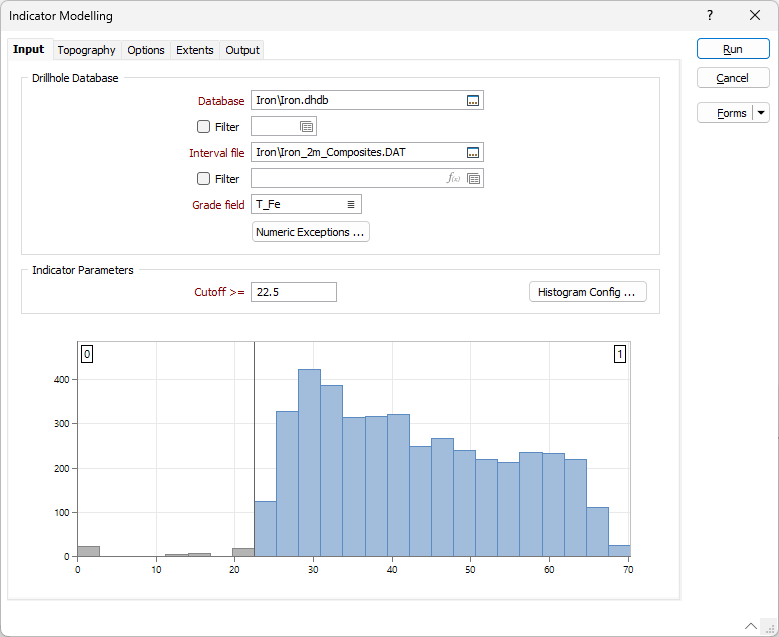
This tool is used where implicit modelling is employed to generate wireframes which represent certain grade domains. The tool guides geologists to make more representative and less volume-biased wireframes used in resource estimation.
The Indicator tool generates grade shells based on indicators (0 or 1) instead of actual metal grades. All values above a determined cut-off value will be assigned a “1” value and the rest will be “0”. This approach removes any inherent bias by including higher grades, as all samples above the cut-off have equal value and so the result will be more representative of mineralised zones.

Drillhole Database
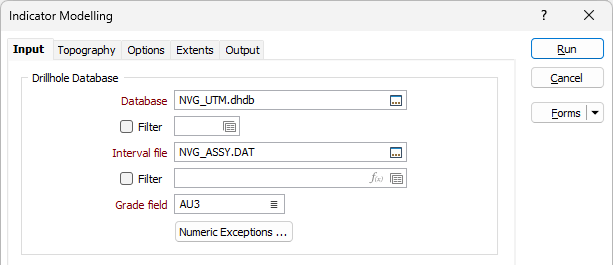
Database
Double-click (F3) to select from a list of databases in the current project. Alternatively, you can right click and choose the Select Database option from the right-click menu. You can also Edit the properties of an existing database or create a New database.
Select the Filter check box if you want to apply a filter to the database. Enter a filter number in the adjacent response. Double click (F3) to see a list of existing filters. Right click (F4) to open the dialog box where you can create a new filter.
Interval file
Double-click (F3) to select an Interval file that contains the information for the Indicator model. An Interval file contains information collected at intervals down a drillhole. You can optionally apply a Filter to the records in the file.
Grade field
Double-click (F3) to select the name of a Numeric field that contains grade information to be used in Indicator modelling process.
Numeric Exceptions
(Optionally) Use the Numeric Exceptions group to control the way that non-numeric values are handled. Non-numeric values include characters, blanks, and values preceded by a less than sign (<).

Indicator Parameters
Cut-Off >=
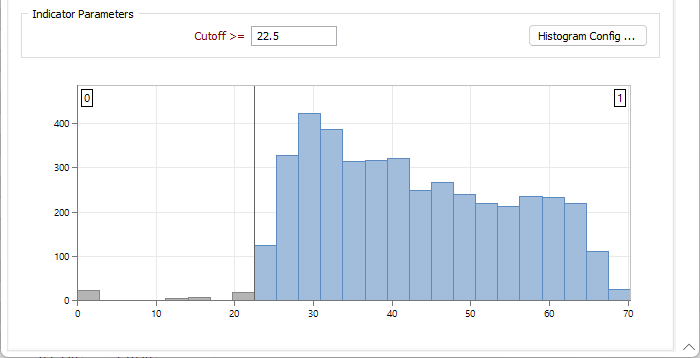
Enter the Cut-Off value for the indicator modelling in the field provided. This option indicates that anything greater than or equal to the entered value will be given an =1 value for the radial basis function (RBF) model.
Histogram Config
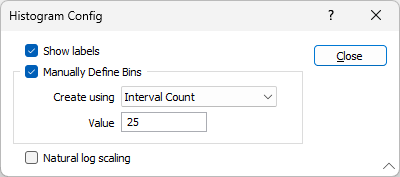
Click the Histogram Config to open a dialog to enter histogram parameters.

Show Labels
Select this check box option to show labels on the histogram.
Manually Define Bins
Select this option to manually divide your histogram data into suitable ranges. If this option is not selected the ranges will be calculated automatically.
Create using
Choose from the following options:
| INTERVAL COUNT | In Value, enter the number of intervals you want to divide the data into. The process will divide your data into the specified number of intervals using the Lower and Upper bound values you have entered. |
| INTERVAL SIZE | In Value, enter the interval (bin) size. The process will use the interval size and the Upper and Lower values you have entered to divide your data. |
Natural Log Scaling
Select the check box to apply the Natural log scale for the data to the indicator parameters.
The chart is previewed at the bottom of the Input tab.

Forms
Click the Forms button to select and open a saved form set, or if a form set has been loaded, save the current form set.
Run
Click Run to run the function.