Grade
![]()
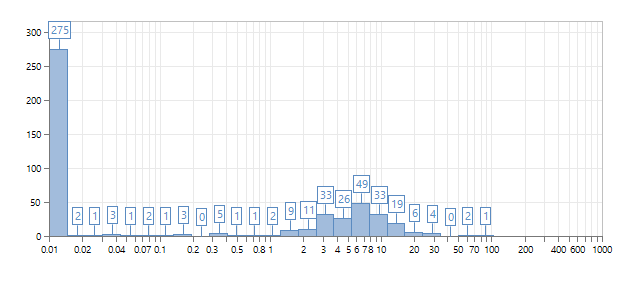
In the Grade Modelling form, you can also specify the upper and lower bounds of a histogram. Ideally, you should use the Downhole Compositing function (on the Drillhole tab, in the Composite group) to composite the input data to fairly long (but reasonable) interval lengths, including waste intervals.
Input
Drillhole Database
Double-click (F3) to select
Select the Filter check box if you want to apply a filter to the database. Enter a filter number in the adjacent response. Double click (F3) to see a list of existing filters. Right click (F4) to open the dialog box where you can create a new filter.
Interval file
Double-click (F3) to select an Interval file that contains the grades you want to interpolate. You can optionally apply a Filter to the records in the file.
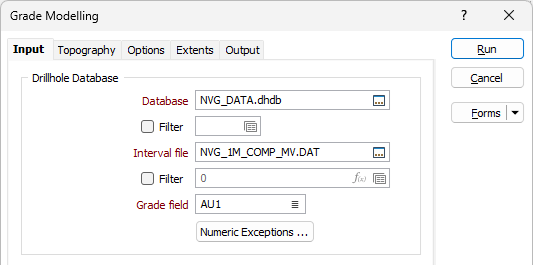
Grade field
Double-click (F3) to select the name of a Numeric field that contains the grades to be interpolated by the process.
Numeric Exceptions
(Optionally) Use the Numeric Exceptions group to control the way that non-numeric values are handled. Non-numeric values include characters, blanks, and values preceded by a less than sign (<).
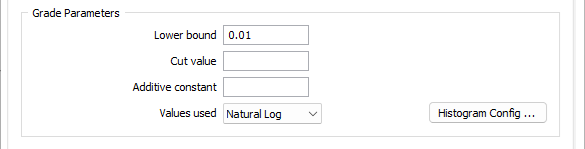
Grade Parameters
Lower bound and (Top) Cut value
Enter the Lower bounds and the Top Cut value of the grades that will be interpolated. Any values less than the Lower bound will be replaced by the Lower bound value. Any values greater than the Top Cut value will be replaced by the Cut value.
Additive constant
If you have chosen NATURAL LOG, specify an Additive constant to normalise the distribution of the natural log data.
Values used
Select the method that will be used to process the data before it is used by the function:
- NONE - in this case the raw form of the data values will be used. This is the default.
- NATURAL LOG - When you need to calculate natural logs from the raw data. You can specify an Additive constant to normalise the distribution of the natural log data.
Note: Grade values less than or equal to 0 are ignored when using natural log transform. If such values are found when running the process, the application will present a warning.

Histogram Config
Click the Histogram Config button to open a dialog to enter histogram parameters. See: Histogram Configuration
A preview of the resultant Histogram is displayed at the bottom of the form according to the values you have entered:
Forms
Click the Forms button to select and open a saved form set, or if a form set has been loaded, save the current form set.
Run
Click Run to run the function.
Note: To better utilise processor resources across multiple applications and tasks, when running computer-intensive operations it may be necessary to reduce the number of cores used by the application.
To modify the number of cores the application can use:
-
Click the Project tab to open the backstage menu.
- Click on the Resources tab of the Options | System | System Options form.