Statistics
![]()
This option is also available on the Lookup Table Editor tab for Lookup Tables.
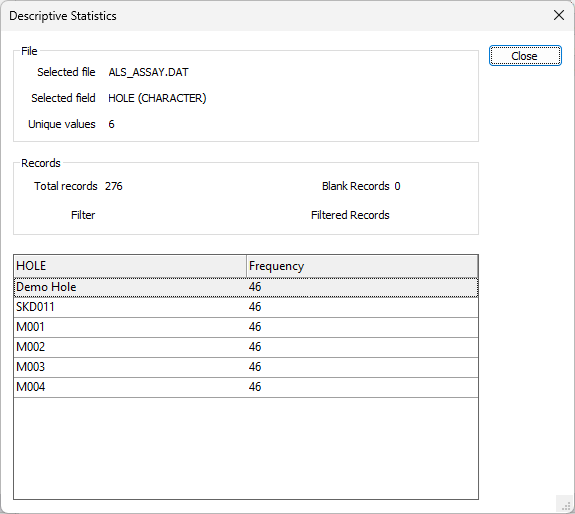
File
The name of the current file and the selected field are shown.
Records
The total number of records in the file, the number of blank records (where values for the current field are blank), are shown. If a filter is applied to the file, the number of filtered records is also shown along with the filter expression text.
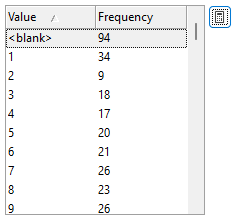
The unique values in a field and their frequency are also reported. This includes blank values. By default the sort order is by Frequency Descending. You can click on the <Field_Name> and Frequency column headings to change the ascending/descending order.
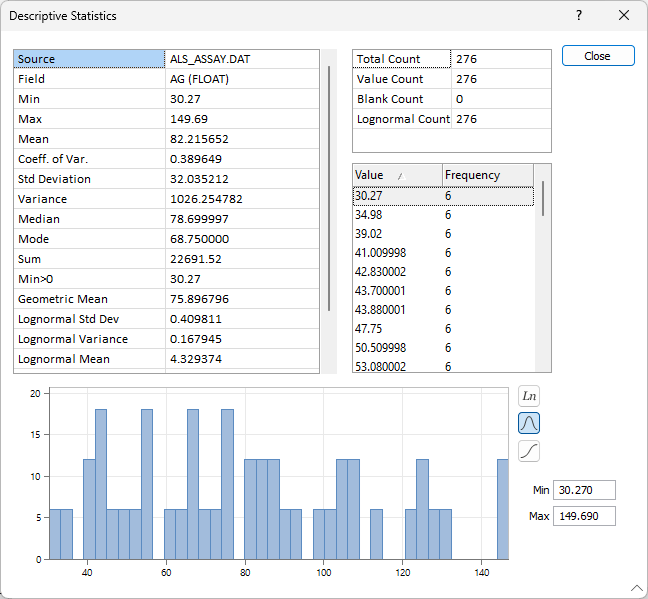
If you have selected a numeric field for display, a more detailed dialog is displayed, with a histogram chart at the bottom. You can use the chart button along the right axis to change the view of the chart.
The process will attempt to list all unique instances and their frequency. If this is not practical due to the size of the file, then the process will list 10 records with the highest frequency, and 10 records with the lowest frequency.
When more than 10,000 records are included, they will not be shown in the table. Instead, a Calculator icon will be available:
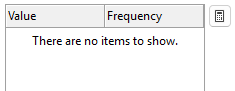
If you click the Calculate button, the list will be populated with no list item limit:
The Calculate button is not required or displayed unless the number of records exceeds 10,000.
You can use the mouse with the SHIFT or CTRL keys to select the records in the result list (or right-click and choose Select All). To copy the selected records to the clipboard, use CTRL + C (or right-click and choose Copy).
Close
Click Close to exit.
Capture Image
To save a screenshot of the Descriptive statistics dialog, right-click on the upper part of the dialog and select Capture Image from the right-click menu.
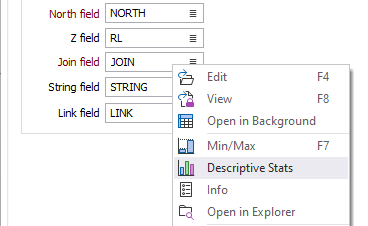
When a Micromine data file is selected in a form, you can now right-click to view Descriptive Stats for the fields you have specified: