Display a legend
The Legend buttons on the Vizex Layer Display pane toolbar allow you to view (but not edit) the colour sets, hatch sets, line sets, and symbol sets that are applied to your display layers.
These buttons are only enabled when the layer selected in the Vizex Layer Display pane has an associated colour set, hatch set, line set, or symbol set.
To display a legend, click the Legend button on the Vizex Layer Display pane toolbar:
![]()
Alternatively, right-click on the display object and select a Legend option from the right-click menu:
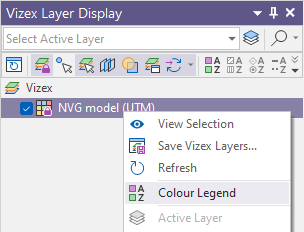
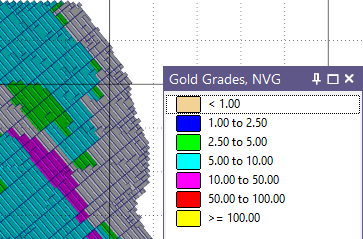
For several layer types, using the 'light bulb' display icons, you can toggle ON and OFF the visibility of each item in the legend:

The visibility options are available for colour and hatch legends on the following drillhole layers:
-
Solid Trace
-
Interval Hatch
-
Graph
-
Interval Label.
Modify a Legend
You cannot directly modify the displayed legend. Instead, you need to modify the colour set, hatch set, line set, or symbol set the legend is based on.
Colour and hatch patterns can be edited by double clicking on the Colour icon for sample in the legend:

None of the changes made are saved to the colour / hatch set.
A displayed legend is updated automatically whenever the underlying colour/hatch/line/symbol form set is edited. When the Refresh All button is clicked, all displayed legends are refreshed.
![]()
Plot a legend
You cannot directly plot the displayed legend. To include a legend in a plot, your plot must contain a legend frame that is based on the same colour, hatch, line, or symbol set.