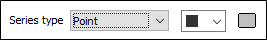
Series type
Choose how the series of data points are shown on the chart:
|
Type |
Description |
|---|---|
|
Line |
A series of data points connected by straight line segments. |
|
Point |
Identical to a line chart, except that only the end points of the segments of each line are shown. |
|
Bar |
A bar chart. |
|
Area |
Like a line chart, except that the area between the X-axis and the line segments is filled with a colour or a pattern. |
|
Step Area |
An area chart in which the points are connected by horizontal and vertical line segments, giving them the appearance of staircase steps. |
Select a marker symbol for the data points. A range of standard (Circle, Square, Diamond, Pentagon, Hexagon, Star, Triangle, Plus, Cross) marker symbols are available for selection in a drop-down list.
This option is disabled when the Bar series type has been selected.
Double-click on the icon to select a display colour for the series.