Fonts and Lines
Use the options on the Fonts and lines tab to customise the appearance of the labels and lines on the frame.
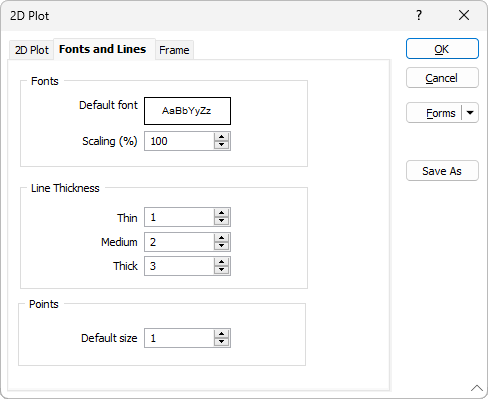
Fonts
Select the Default font and Scaling that will be applied to the labels on the plot.
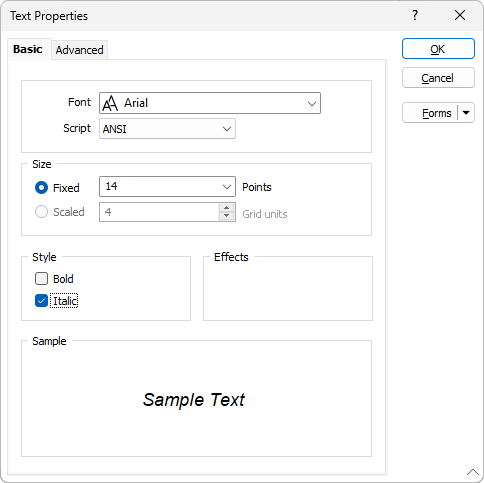
You can double click the Font preview to open the Text Properties form and make changes to the font settings for the frame.
A Scaling value is entered as a percentage (%). A value less than 100 will reduce the size of the font. A value greater than 100 will increase the size of the font.
Line Thickness
Select the thickness that can be applied to the grid lines on the plot.
Points
Select the default size of the points on the plot.