Graticule Frame
A Graticule can be added to a plot to show lines of latitude and longitude. To add a Graticule to a plot:
- Right-click on the plot frame (in the layout window or the Frames pane) and select Add Graticule. Alternatively, double-click on the Graticule form set type in the Plot Forms pane.
- Set the following parameters on the Lines tab of the Graticule form:
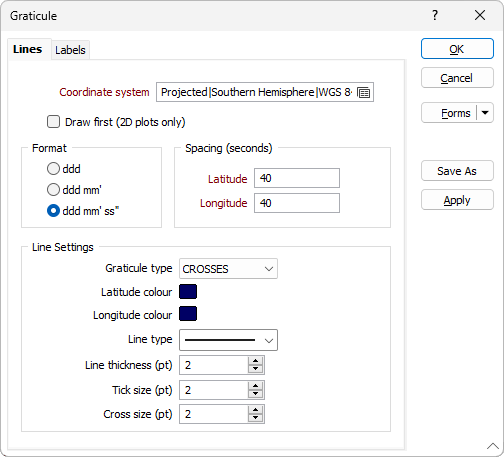
Coordinate System
Common coordinate systems are provided in a library of form sets. Double-click in the Coordinate System box to select an embedded "Coordinate System" form set. The Coordinate System form consists of three (Projection, Parameters and Plane) tabs.
The Plot Editor does not know the coordinate system of the underlying data, so it draws a graticule by un-projecting the data. Because of this it cannot do an on-the-fly datum transformation (simply because it does not know the original datum).
Also be aware that the datum transformation parameters are to WGS 84.
For the graticule to be correctly displayed relative to the underlying data, you must first transform the underlying data to a projected coordinate system before you plot it. Only then will the graticule be correct.
Format
There are three formats for graticule labels:
- ddd°
- ddd° mm’
- ddd° mm’ ss”
Select one of these options. The units in which you must specify the graticule spacing changes according to which of these options you select.
Spacing
Set the graticule line spacing for the format you have selected.
Line Settings
Graticule Type
Select the type of graticule to display:
- FULL draws lines from one side of the paper to the other.
- CROSSES draws tic marks around the plot border and crosses wherever grid lines intersect.
- TICKS draws tic marks around the plot border.
Latitude and Longitude Colour
Double click in the response boxes to specify the Colour of the lines of longitude and latitude.
Line Type
Select a Line Type from the drop-down list of (SOLID, DASH, DOT, DASH DOT, DASH 2 DOTS) line style options.
Line Thickness
Enter a Line thickness in points.
Tick Size
Enter a Tick Size in points. This is the length of the tick lines.
Cross Size
Enter a Cross Size in points. This is the length of the cross lines.
When a spin control has focus, you can use the mouse wheel to increase or decrease the displayed value.
Labels
Click on the Labels tab to specify how the graticule lines will be labelled.
In the case of a grid or a graticule there are no common (fill, border, and margin) frame properties to specify, since the grid or graticule is added as a child frame of the parent plot frame and automatically fills the extents of the parent plot frame.
You can only select a grid or a graticule in the Plot Frames pane.