Просмотр Анализа поиска
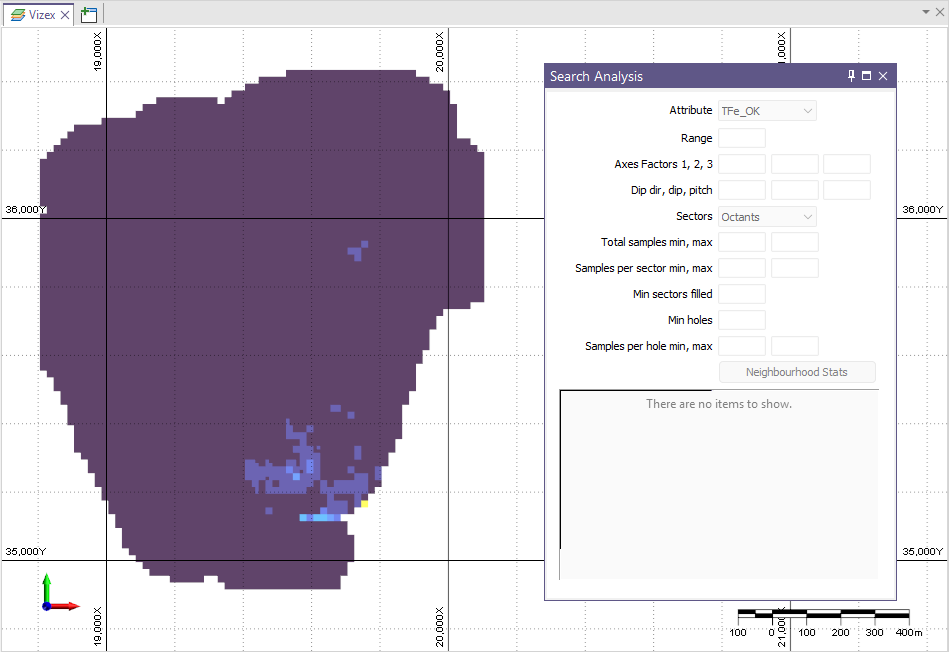
При запуске инструмента Анализ поиска блочная модель, рассчитанная интерполятором содержаний, отображается в Визексе, открывается панель информации Анализ поиска и активируется вкладка Анализ поиска.
При запуске инструмента анализа поиска создается блочная модель, которая при необходимости помечается для доменов, даже если блочная модель отображается в Визексе. При выборе блока выполняется расчет стоимости для этого отдельного блока с использованием критериев поиска, определенных в форме.
Примечание: Важно понимать, что если модель выходного блока оценивалась с использованием других областей или критериев поиска, отличных от тех, которые определены в инструменте анализа поиска, результаты будут отличаться.
Использование Анализа поиска
Когда вы выбираете блок в отображаемой модели, дисплей обновляется: остаются видимыми только выбранный блок и связанный с ним эллипсоид поиска, а информация о блоке выводится в панели Анализ поиска:
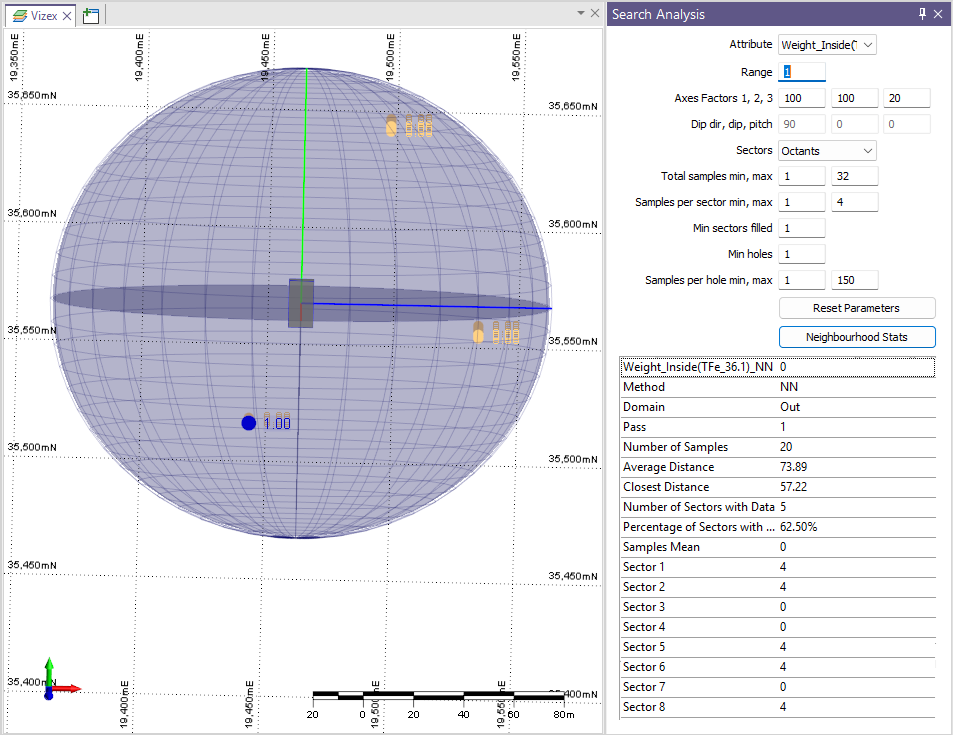
Отображение эллипсоида поиска, проб и блочной модели можно включать и выключать с помощью инструментов Анализа поиска.
Примечание: При использовании файла структурного тренда для управления ориентацией и анизотропией отображаемый эллипсоид поиска будет лишь приближением фактического эллипсоида, применяемого при оценке. В «пространстве тренда» (Trend space) эллипсоид может быть «изогнут», поэтому в оценку могут попадать пробы, которые визуально располагаются немного вне отображаемого эллипсоида.
В панели Анализ поиска отображаются следующие данные для выбранного блока или пробы. Где это возможно, вы можете напрямую изменять значения отображаемых данных в информационной панели Анализ поиска.
Атрибут
Значения атрибутов, полученные в результате работы Интерполятора содержаний, доступны для выбора в выпадающем списке. Выберите атрибут, чтобы отобразить информацию Анализа поиска для этого атрибута.
Диапазон
Введите значение Диапазона для отображаемого эллипсоида поиска или примите значение по умолчанию - 1. Радиусы эллипсоида поиска будут равны Диапазон × Коэффициенты осей.
Коэффициенты осей
Используйте предоставленные поля, чтобы ввести коэффициенты осей эллипсоида поиска для оси 1, оси 2 и оси 3 соответственно. См. раздел Параметры эллипсоида поиска.
Направление падения, угол падения, склонение
Любая доступная информация о направлении падения, угле падения и склонении из запуска Интерполятора содержаний отображается в этих полях.
Секторы
С помощью выпадающего списка Секторы можно выбрать количество секторов, на которые делится отображаемый эллипсоид поиска для анализа поиска. См. раздел Секторы.
Общее количество проб - мин, макс
Значения Минимальное и Максимальное общее количество проб из запуска Интерполятора содержаний отображаются в этих полях.
Количество проб на сектор - мин, макс
Значения Минимальное и Максимальное количество проб на сектор из запуска Интерполятора содержаний отображаются в этих полях.
Минимальное заполнение секторов
Значение Минимальное количество заполненных секторов из информации о критериях поиска Интерполятора содержаний отображается в этом поле.
Мин. количество скважин
Если для информации по Итерации поиска в запуске Интерполятора содержаний задано поле Скважина, значение Минимальное количество скважин отображается в этом поле.
Количество проб на скважину - мин, макс
Если для информации по проходам оценки задано поле Скважина, значения Минимальное и Максимальное количество проб на скважину отображаются в этих полях.
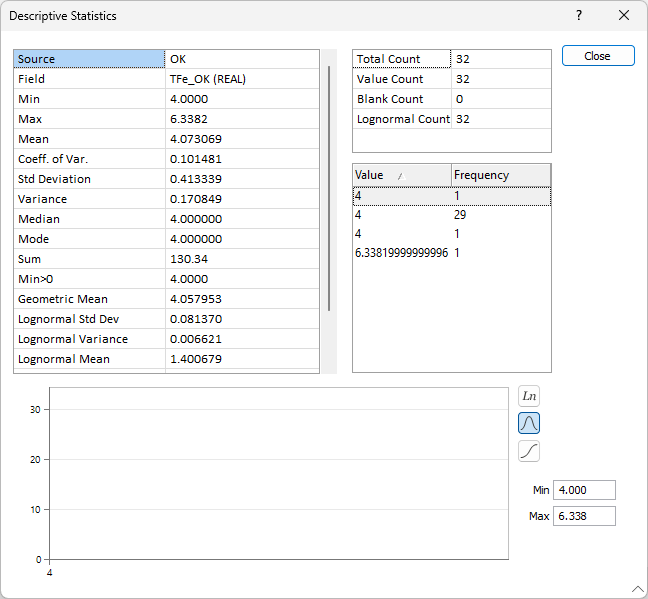
Статистика окружения
Кнопка Статистика окружения открывает форму Описательная статистика для запуска Интерполятора содержаний. В нижней части формы отображается гистограмма. С помощью кнопок на правой оси диаграммы можно изменить вид отображения графика. См. раздел Статистика.
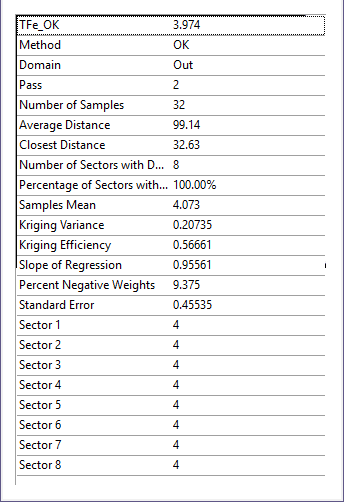
Оценочные значения
В панели «Оценочные значения» в разделе «Информация об анализе поиска» отображаются оценочные значения для выбранного блока/пробы.
Инструменты
С помощью инструментов на вкладке «Анализ поиска» вы можете настроить отображение блочной модели и содержащихся в ней проб, а также настроить и перемещаться по разделам данных.
|
|
Нажмите Редактировать форму, чтобы открыть набор форм Анализ поиска и настроить параметры оценки. |
|
|
Нажмите Все пробы, чтобы отобразить все точки проб, независимо от выбранного блока. |
|
|
Нажмите Пробы в эллипсоиде, чтобы отображать только точки проб, находящиеся внутри эллипсоида для выбранного блока. |
|
|
Нажмите Пробы в оценке, чтобы отображать только точки проб, использованные в оценке для выбранного блока. |
|
|
Нажмите Эллипсоид, чтобы отобразить эллипсоид поиска, используемый для нахождения соседних проб для выбранного блока. |
|
|
Нажмите Блочная модель, чтобы отобразить блочную модель с показом анализа поиска для выбранного блока в режиме затемнённого отображения. |
|
|
Нажмите Блок, чтобы отобразить выбранный блок. |
|
|
Нажмите Евклидово расстояние, чтобы отобразить для каждой точки метку, указывающую ее расстояние от центра блока. |
|
|
Нажмите Веса при оценке, чтобы отобразить на каждой точке метку, показывающую её вес в расчёте блока. |
|
|
Нажмите Выбрать другой блок, чтобы снять выделение с текущего блока и выбрать другой. |
В блочной модели можно создавать и использовать разрезы для упрощения навигации и выбора определенных блоков. Если вы хотите использовать/создавать разрезы в данных анализа поиска:
|
|
Нажмите Ограничение, чтобы включить или выключить режим обрезки. Режим ограничения включается автоматически, когда вы используете инструмент Определить разрез для определения разреза. Опцию Ограничения также можно включать/отключать в строке состояния. |
|
|
Нажмите Определить разрез, чтобы перетащить мышь и определить раздел. Используйте CTRL для привязки угловых шагов (0-30-45-60-90 °). |
|
|
Нажмите Определить разрез (одна точка), чтобы выбрать точку для определения разреза. |
|
|
нажмите на Определить разрез (по трем точкам), после чего выберите три точки, чтобы определить по ним разрез. Удерживайте нажатой клавишу SHIFT, чтобы открыть данные в новом окне. |
|
|
Нажмите Определить плоскость среза, чтобы перетащить мышь и определить плоскость среза. |
|
|
нажмите на Определить разрез по полилинии, чтобы задать несколько разрезов, оцифровав полилинию (диаграмма разреза). |
|
|
|
|
|
Нажмите Следующий разрез (SHIFT + Page Down), чтобы перейти к следующему разрезу в контрольном файле разрезов. |
|
|
Нажмите Переместить плоскость, чтобы переместить плоскость разреза с помощью мыши. Если окно просмотра выровнено относительно текущей плоскости разреза, двигая мышь вверх и вниз, вы можете перемещать плоскость от себя и к себе соответственно. Если окно просмотра НЕ выровнено относительно текущей плоскости разреза, движение мышью вверх и вниз будет перемещать плоскость. Чтобы переместить окружение, сохраняя положение текущей плоскости разреза, нажмите на клавишу CTRL, передвигая курсор мыши. |
|
|
Нажмите Выровнять плоскости (или кнопку ДОМОЙ), чтобы выровнять вид с текущей плоскостью разреза. |
|
|
Нажмите Привязать плоскость, чтобы привязать плоскость разреза к ближайшему кратному значению Шага (относительно текущего активного разреза, если таковой имеется, или относительно точки 0, 0, 0). |