Results
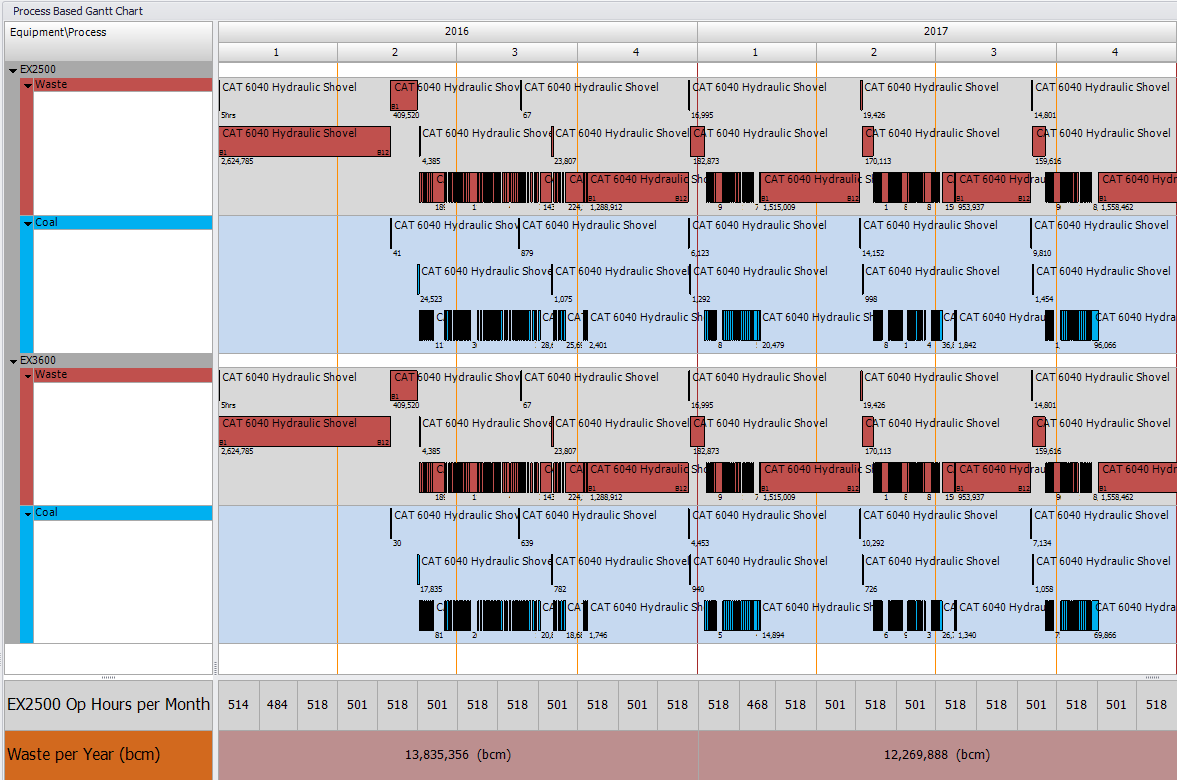
Use the Results tab of the Gantt Settings window to present rows of results at the bottom of your Gantt Chart split by Reporting Period, such as Operating Hours, Source Quantity and Value Custom Fields.
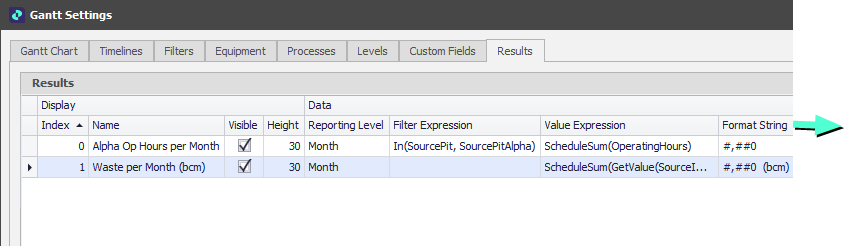
Note: When using a Value Expression, make sure you use the Schedule Result Functions (e.g ScheduleSum, ScheduleWeightAvg) as you are presenting an aggregated result. For example:
ScheduleSum(OperatingHours)
Bulk Editor
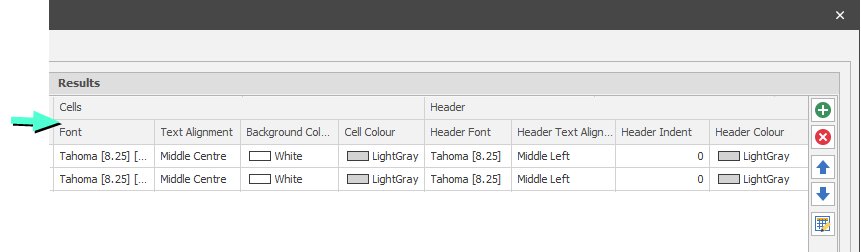
Click the Bulk Editor button (on the far right of the page) to make bulk changes to the items on the page using the spreadsheet functions provided by the application.

For more information, see: Bulk Editor