Pivot Tables
![]()
A Pivot Table is a data summarisation tool that can automatically sort, provide totals or give the average of the data stored. A simple tip for Pivot Tables is to become familiar with the right-click menu (Remove Fields From Field Area is particularly useful). For a more detailed explanation of pivot tables in general visit: http://en.wikipedia.org/wiki/Pivot_table
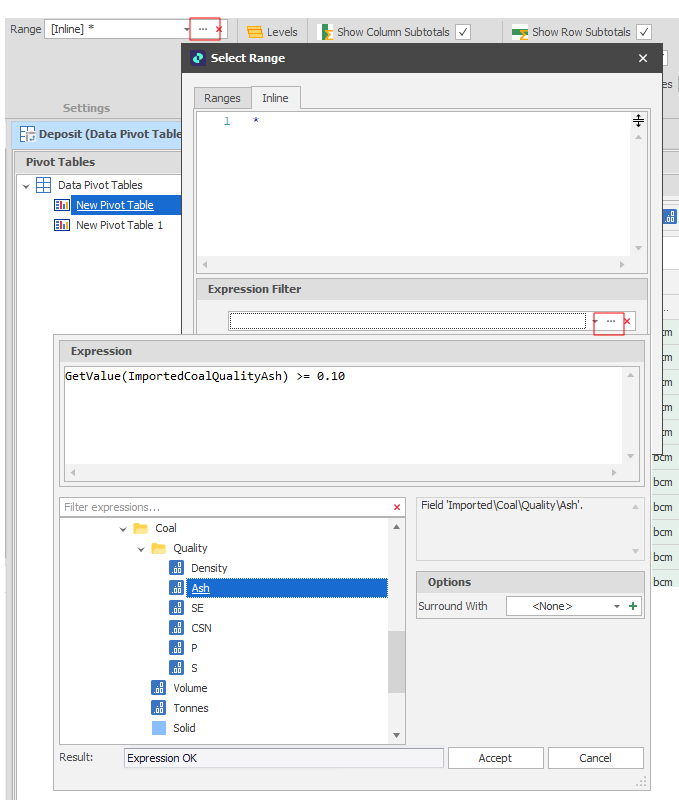
When setting an Inline Range, an Expression Filter can be applied to the underlying table data. For example, to filter solids that do not have an ash content greater than or equal to 10 percent:
The basic concepts of Pivot Tables are:
- Summation Values: Called the Data Area in the application. Can use any numeric Variable including Value Type Custom Fields including Volumes, Distances, Times, Rates etc.
- Row and Column Labels: Called the Row and Column Area in the application. Can use any text or date Variable Filter Type Custom Fields including Leaf Positions, Process, Equipment, Reporting Periods etc.
You can also use multiple types of filters to show or remove anything in each individual Pivot Table. See: Filter Editor

Empty Row and Column Labels
One important feature to be aware of in Pivot Tables is that there are times when your row and column labels will be empty. Let's say you created a monthly Reporting Period, but only covered the first year and used it as your Row Label. Any summation value that falls outside the Reporting Period appears as a blank like the screenshot below.
![]()
In the example above it's a consequence of a Reporting Period setting (which can be resolved by recreating or amending the Reporting Period to include more periods) but an example where this feature can be particularly useful is during destination scheduling where you can use it to check your dump balance.
Finally, if you haven't used Pivot Tables before it's quite possible to create nonsensical reports with too many columns and/or rows. Don't worry! With a little patience you'll get the hang of it.
Pivot Tables are drag-and-drop. Drag your Row and Column Labels and Summation Values straight into the position you want and your Pivot Table will be populated immediately. Custom Fields will appear by default, as well as Reporting Periods which appear as "Period YourPeriodName"
By default, you don't see all of the Labels and Values that you have available. To see the full list, right-click the header that has the various drag-and-drop items and choose Show Field List.

You can export your Pivot Table as either XLS(X), PDF or CSV using the contextual Import/Export menu at the top of the application window. See: Results

Pivot Table Charts
To enable charts on your Pivot Table click the small arrow at the bottom of the Pivot Table Window.
There are several options regarding the display and exporting of Pivot Table Charts available by right-clicking the Chart itself.

To use Column Data instead of Row Data, or for other options right-click the Pivot Table Chart.

Blank Pivot Tables occur for one of two reasons. Either your Output Schedule has been reset (and you have no results) or your filters are preventing any results from appearing. Rerun your schedule to populate your results and/or "Clear All Filters" from the Pivot Table Header right-click menu to remove any filters that may be preventing results from appearing.
You will need to create a Reporting Period (under Sections) for each time frame that you want to aggregate your results by. Add the Reporting Period then rerun your Schedule to see the result.
This demonstrates that something has changed in the Scenario which may change the results. Running the Scenario will update the results.