Display
On the Display tab of the Graph form, set the (Points, Lines, Bars) type of the graph and set the display characteristics of that type.
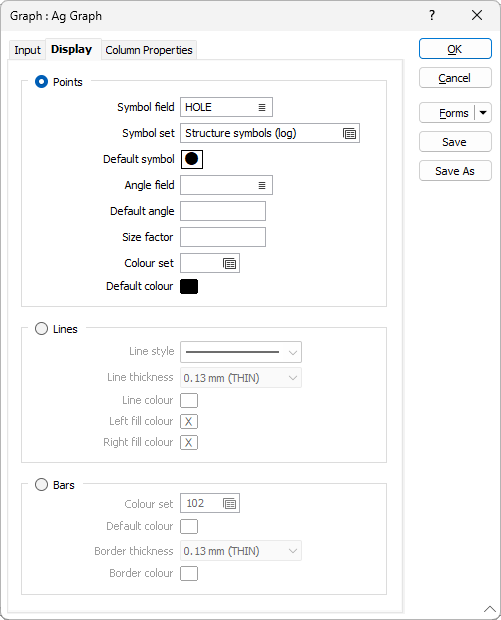
Points
When this option is selected, each value is shown as a point symbol on the graph.
Symbol field
Enter the name of the field (in the file) containing the data that will control which symbol is displayed.
Symbol Set
Select the Symbol Set that is associated with the Symbol field. This set maps symbols to text strings or numeric ranges. For each record in the file, the symbol is determined by the value in this field.
Default symbol
Double-click on the Symbol icon to select a default point symbol from a symbols palette.
Angle field
Enter the name of the field containing symbol angle values (0-360°). A value of 0 will display the symbol in its natural orientation. A value of 90 will display the symbol rotated 90° in the clockwise direction.
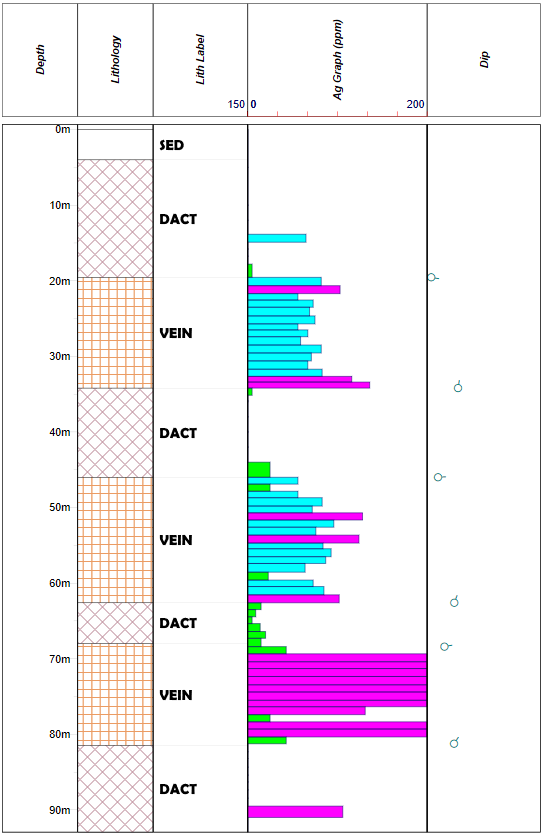
Using the Angle field, it is possible to create a traditional 'tadpole' plot by setting the Graph value in the Input tab to True Dip and the Angle field for the symbol to Dip Direction:
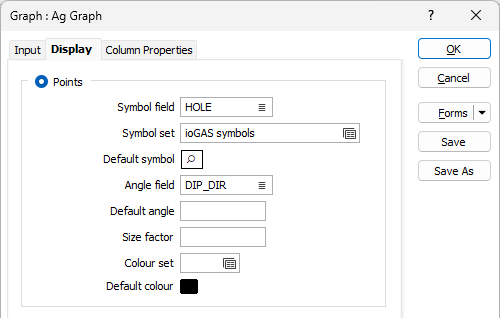
This will plot the 'tadpole' symbol at the specified angle for the points, indicating dip angle and direction - as shown in the Dip column in the following:
Default angle
Enter the default angle, in degrees, that will be applied to symbols at points where there is no entry in the symbol angle field.
Size factor
Optionally enter a point size factor. The default is 1. Enter a value greater than 0.0 and less that 1.0 to decrease the size of the point and a value greater than 1.0 to increase the size of the point.
Colour set
To map values in the Colour field to the colour values in a Colour set, double click (F3) to select the set that will be used to control the display colour. Right-click (F4) to create or edit a Colour set.
Default colour
Double-click (F3) to select the colour that will be used when a Colour field or a Colour set is not defined - or when a value in the Colour field is either not valid or is not mapped in the Colour set.
Lines
When this option is selected, a smoothed line is drawn between the values on the graph.
Line style
Select a line style. A preview of each style is shown in the drop-down list. A variety of solid, dotted, and dashed line styles are available for selection.
Line thickness
Use the drop-down menu to select a (THIN, MEDIUM, THICK or other) line thickness.
Line colour
Set the colour of the lines on the graph. Double-click on the Colour icon to select a colour from a colour palette.
Bars
When this option is selected, each value is shown as a bar on the graph.
Colour set
To map values in the Colour field to the colour values in a Colour set, double click (F3) to select the set that will be used to control the display colour. Right-click (F4) to create or edit a Colour set.
Default colour
Double-click (F3) to select the colour that will be used when a Colour field or a Colour set is not defined - or when a value in the Colour field is either not valid or is not mapped in the Colour set.
Border thickness
Use the drop-down menu to select a (THIN, MEDIUM, THICK or other) border thickness for the bars.
Border colour
Set the colour of the border. Double-click on the Colour icon to select a colour from a colour palette.