Graph
On the Input tab of the Graph form, select the Interval (or Event) data that you want to graph.
Input File
You can display graphs (histograms) of Interval file or Event file data. Event occur at specific depths down the hole.
Double-click (or click on the Select icon) to select the name of the file that contains the data you want to display. You can also click the Pick from Vizex button to collapse the form and interactively select a layer containing the file to be inserted and return to the form.
Select the Filter check box if you want to apply a filter to the file.
Enter a Filter Number in the adjacent box. Double click (F3) to see a list of existing filters. Right click (F4) to open the dialog box where you can create a new filter.
A filter can be useful when you want to apply a restriction on a field other than the one being displayed, for example, to show the assays in a particular zone, or show the assays for specific holes.
Field
Graph field
Double-click (or click on the Select icon) to select the name of the Graph field in the Interval file. The Graph field must contain the data that will be displayed on the graph beside the trace. If you are displaying graphs of events, you need to enter the name of the field containing the depth at which the events occur.
Mode
Select a graph mode. You can use values directly from the nominated field in the input file, or you can take natural logs of the data before it is displayed. To use the base values as they occur, choose NORMAL from the Mode list. Choose NATURAL LOG to convert the values before they are displayed.
Minimum and Maximum (Cutoff)
You may need to recalculate the minimum and maximum graph values to produce a correct histogram from older (earlier version) form sets, but generally only for those incorporating the natural log transformation.
To change the graph minimum/maximum, click the calculator icons to the right of the Minimum and Maximum values.
![]()
You should not have to change the graph minimum or maximum of existing forms incorporating normally-distributed data.
Align
Select an alignment option. The graph can be aligned to the LEFT or RIGHT of the column.
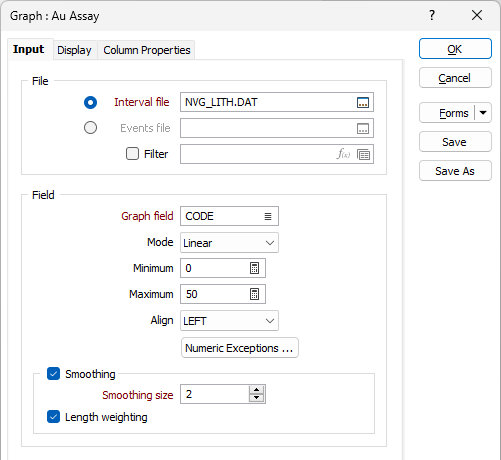
Numeric Exceptions
Downhole readings are taken at regular (often centimetre) intervals. Often there are no valid readings near the top of the hole and these need to be ignored when drawing the graph.
(Optionally) Use the Numeric Exceptions group to control the way that non-numeric values are handled. Non-numeric values include characters, blanks, and values preceded by a less than sign (<).
Smoothing
To smooth curve data, specify a Smoothing size which is the number of points used in a moving average filter. You must specify at least 2 points. The greater the number of points, the smoother the curve.
A smoothing size of 11 will take each data point and average them with 5 data points above and 5 data points below, and then plot those points with their moving average values rather than their actual values.
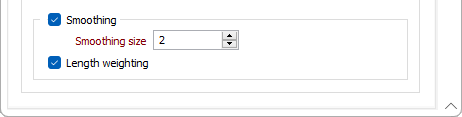
Select the Length Weighting option to apply a length weighting to the smoothed data. This may be useful for data with interval lengths that vary significantly.
Scalebar
If you want to display a scalebar with the graph, select this option. The scalebar will extend from the bottom of the hole. If the bottom of the hole does not occur on the section, the scalebar is displayed where the hole exits the section.
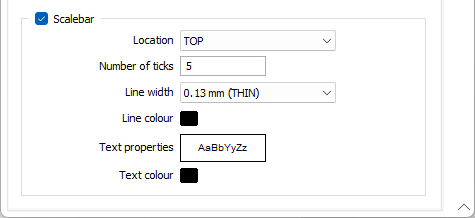
Location
Specify a (TOP or BOTTOM) location for the scalebar within the column.
Number of ticks
Define the number of ticks that will be displayed between the minimum and maximum values on the graph.
Line width
Specify the width of the line that will be drawn around the edge of the scalebar.
Line colour
Double click (F3) to select the colour to be applied to the ticks on the scalebar.
Text properties
Double-click on the Text Properties Preview box to select a font and set text properties.
Text colour
Double click (F3) to select the colour to be applied to the text on the scalebar.
Forms
Click the Forms button to select and open a saved form set, or if a form set has been loaded, save the current form set.
By design, the Forms button is not available for loaded Vizex layers (i.e. when opening the form set properties of a layer in the Vizex Layer Display pane). In Vizex, the Forms button is only available for new forms opened via the Home tab or the Vizex tab, in the Layer group (or by double-clicking on a form type node in the Vizex Layer Types pane).
Save and Save As
Click the Save button to save the changes you have made to the form set. Click Save As to save your changes as a new form set. Save As will default to the first available form set number.
Reset
Click Reset to clear the form of all values and reset the form to its default state.
Reset Tab
For tabbed forms, select Reset Tab to clear the active tab of all values and reset the tab to its default state - without making any changes to other tabs in the dialog.
Undo and Redo
Click Undo (CTRL + Z) to undo recent changes in the form. After an Undo, click Redo (CTRL + Y) to restore the last change that was undone.
Collapse
Collapse (roll-up) the form to preview a chart, or preview the results of an operation in Vizex, or obtain input values from Vizex, the Property Window, the File Editor, or the Plot Editor.