Creating a Chrono Table Example (Digger Tracker)
This topic describes how to make a simple digger utilization table.
Table Setup
-
Add a new Chrono report.
-
Rename the report to “Digger Tracker”.
-
Select the Table Setup tab.
-
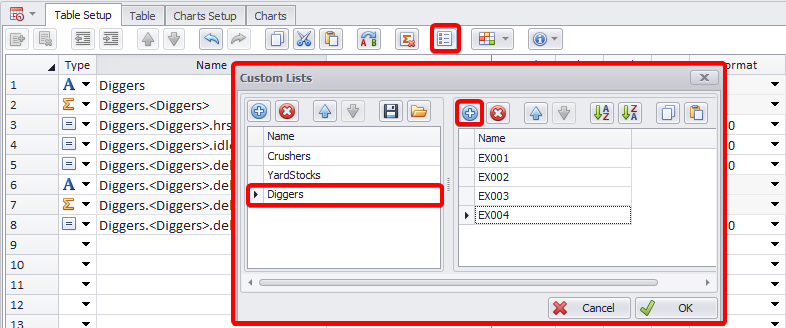
Click theManage Custom Lists icon to create a new list.
-
In the Custom Lists dialog, create a new list called “Diggers”.
-
Add each digger name to the list.
-
-
Populate the setup as shown in the table below.
| Row | Type | Name | Caption | Indent | Data Source | Item | Filter 1 Field | Filter 1 Value | Filter 2 Field | Filter 2 Value |
|---|---|---|---|---|---|---|---|---|---|---|
| 1 | Title | Diggers | Diggers | 0 |
|
|
||||
| 2 | Iterator | Diggers.<Diggers> | <Diggers> | 1 | CustomLists | Diggers | ||||
| 3 | Row | Diggers.<Diggers>.hrs | Active Hrs | 2 | Agents | Time.AgentWorkingCalendarHours |
Agent.Name |
<Diggers> |
||
| 4 | Row | Diggers.<Diggers>.idle | Idle Hrs | 2 | Agents | Time.EngineOnHours |
Agent.Name |
<Diggers> |
Agent.Delay |
Do Nothing |
| 5 | Row | Diggers.<Diggers>.delay | Delay Hrs | 2 | Agents | Time.AgentWorkingCalendarHours |
Agent.Name |
<Diggers> |
Agent.Delay |
!Do Nothing |
| 6 | Title | Diggers.<Diggers>.delays | Inactive Hrs | 2 |
|
|||||
| 7 | Iterator | Diggers.<Diggers>.delays.<Agent.Delay> | <Agent.Delay> | 3 | Agents | Agent.Delay |
|
|||
| 8 | Row | Diggers.<Diggers>.delays.<Agent.Delay>.delay | Delay Hrs | 4 | Agents | Time.UnavailableHours |
Agent.Name |
<Diggers> |

Digger Tracker Setup
Table
If all the fields are filled out correctly and there are no errors in the Errors List panel, the Table tab will be active and the table in it will look like shown below:

Digger tracker table
Chart Setup
-
Open the Chart Setup tab.
-
Add a new chart.
-
Rename the chart to “EX001”.
-
In the Primary Axis panel, change the caption to “Hours” and the format to “0.0%”.
-
In the Series panel, add three series and name them “Active”, “Delayed”, “Idle”.
-
Set the fields to “Diggers.EX001.ProdHrs”, “Diggers.EX001.Delay” and “Diggers.EX001.Idle”.
-
Set the Series Types to “FullStackedBar”.
-
Select colours for each bar.
-
Repeat for each digger.

Data setup in the Charts Setup tab
Chart
If no mistakes were made during the charts setup, you can open the Charts tab and view the results.

Charts overview in the Charts tab
You can change the charts view in the Charts tab by simply dragging the headers to the desired positions.