Period Plot Report
A Period Plot Report is used to present 2D graphical plots of the selected activities in a given time period.
Period Plots Report
What’s New
In APS versions 22.2 and newer, the functionality to create Period Plots has been moved into the Reporting tab. Therefore, the Period Plots tab in the Schedule is no longer present. In addition, several new configuration options have been added, including the ability only to show benches that have been scheduled and the ability to view the benches in a List form rather than a Tree form.

Period Plots reports moved to Reporting tab
Setup

In the Setup tab, set the display parameters for the different components.

Plot Report Setup section
Plot Setup items are explained in the table below:
Settings |
Main settings of the plot content. |
|---|---|
|
Activity |
Select the Activities to report. List will be filters based on the Production Mode Features setup. |
|
Label |
Use the Labels drop-down to select which labels you want to display on the plot (for example, drilling meters for the ProductionDrilling activity or wet_tonnes for Mining). The default setting is <Record Name>. |
|
Period Subset |
Select what Period Subset to show. The available subsets are configured in the Period Subsets step. The default setting is <All Periods>. |
|
Show Scale |
Select how to display a scale for the plot ("Scale", "Grid", "None").
|
|
Expand Distance (m) |
Optionally specify Expand Distance, in meters. |
|
Draw Layers Over Blocks |
Flag this option, if you want to draw layers over blocks. Note that only polyline layers can be displayed. |
|
Display Increment As |
Select how you want to display benches/lifts, in a Tree form or in a List form.
|
|
Draw Only Scheduled Blocks |
Flag this option, if you don’t want to display outlines for unscheduled blocks. |
|
Show Only Scheduled Increments |
Flag this option, if you want to display in the tree/list of benches only those that are scheduled in your plan. The increments that are not being worked on during the specified time period will not be included in the list.
|
|
Shading Opacity |
Specify a preferred Shading Opacity, from 0.1 to 1. |
|
Scheduled Hatch Pattern |
Select from the drop-down a preferred Hatch Pattern for the Scheduled Blocks. For better illustration, “Solid” type is recommended. |
|
Already Done Text |
Text for already done (already drilled/charged/mined) blocks, that will be shown in the Legend. The default text is <Already Done>. |
|
Already Done Hatch Pattern |
Hatch Pattern of already done blocks. |
|
Already Done Color |
Color of already done blocks. |
Period |
Periods display settings. |
|
Min Period |
Select from the drop-down Minimum period to show in the plot. The default selection is <Start of Schedule>. |
|
Max Period |
Select from the drop-down Maximum period to show in the plot. The default selection is <End of Schedule>. |
Title |
Title display settings. |
|
Show Title |
Flag to show a selected level Title at the top. |
|
Font |
Title font selection. |
|
Size |
Title size selection. |
|
Style |
Title style selection. |
Labels |
Labels display settings. |
|
Show Labels |
Flag to show a block property (i.e. blast type) over every block. |
|
Font |
Label font selection. |
|
Size |
Label size selection. |
|
Style |
Label style selection. |
|
Show Labels only for Scheduled Blocks |
Flag to show labels only for scheduled blocks. |
Legends |
Legend display settings. |
|
Show Legends |
If Show Legends is ticked, you will see a legend of color assignments by period on the right side of the viewport. |
|
Font |
Legend font selection. |
|
Size |
Legend size selection. |
|
Style |
Legend style selection. |
|
Show Used Periods Only |
Flag to show used periods only. |
Image Size |
Exported image settings. |
|
Width |
Enter the width of the plot. |
|
Height |
Enter the height of the plot. |


Results
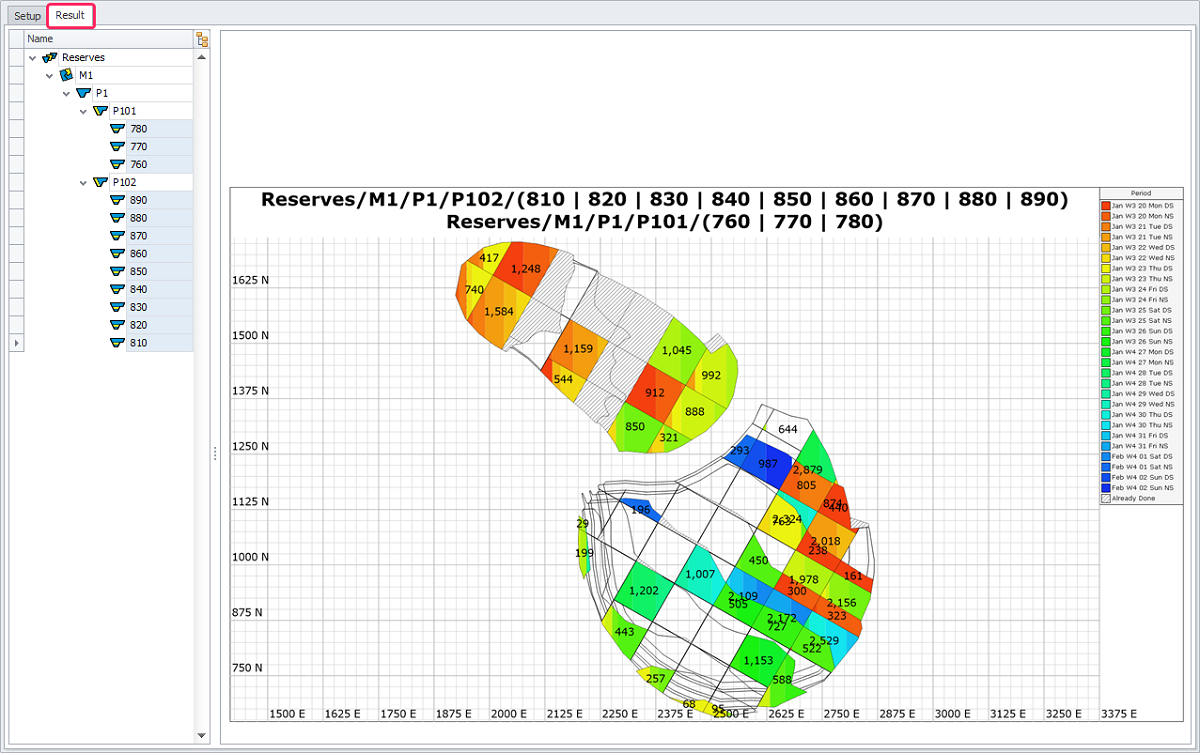
Select a bench/flitch or lift from the tree/list on the left and its blocks will be displayed in the main viewport.
Select the Activity to display from the bottom left.
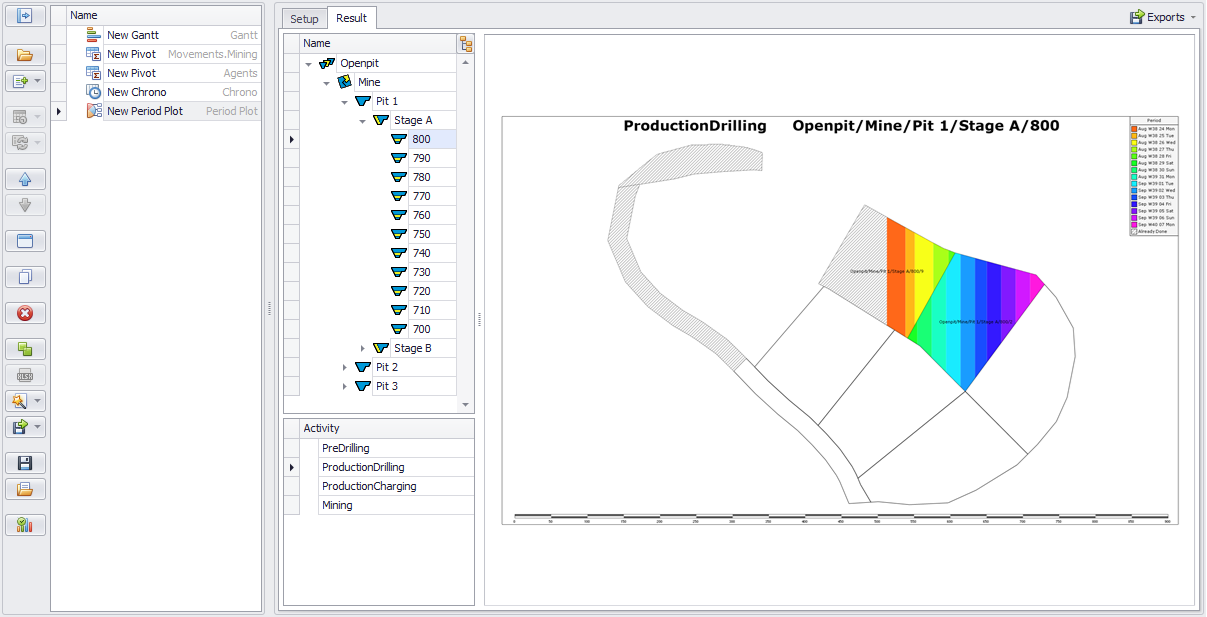
Select the Level(s) and Activity to display in the Result tab
Use the <CTRL> and <SHIFT> keys to select multiple levels from the tree structure on the left.
Note that it is not possible to display the level of the entire pit or stage, the selection may only contain benches, flitches and lifts.
Nor is it possible to display more than one Activity in a period plot.
Exporting Results
You can save the displayed plot directly from the viewport by right-clicking and selecting Save from the drop-down.
Results tab > right click > Save option
-
In the Save As window specify the export path, name and format of the plot being exported, and click Save.
-
Open the saved file to review the results.
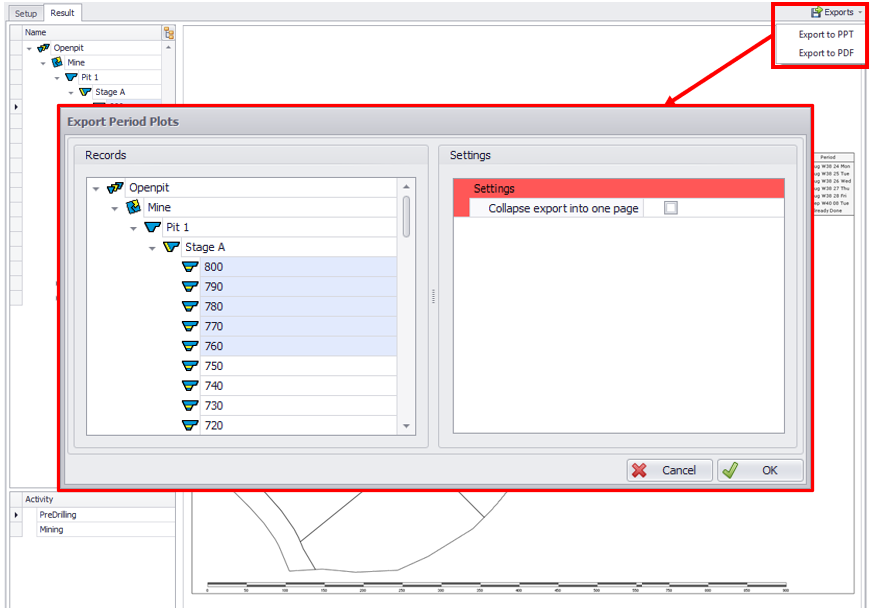
Exports allows user to export multiple benches directly to Powerpoint and PDF.
Use the Collapse Export Into One Page option to create a single output with all selected benches.
Note this will only export the activity selected.
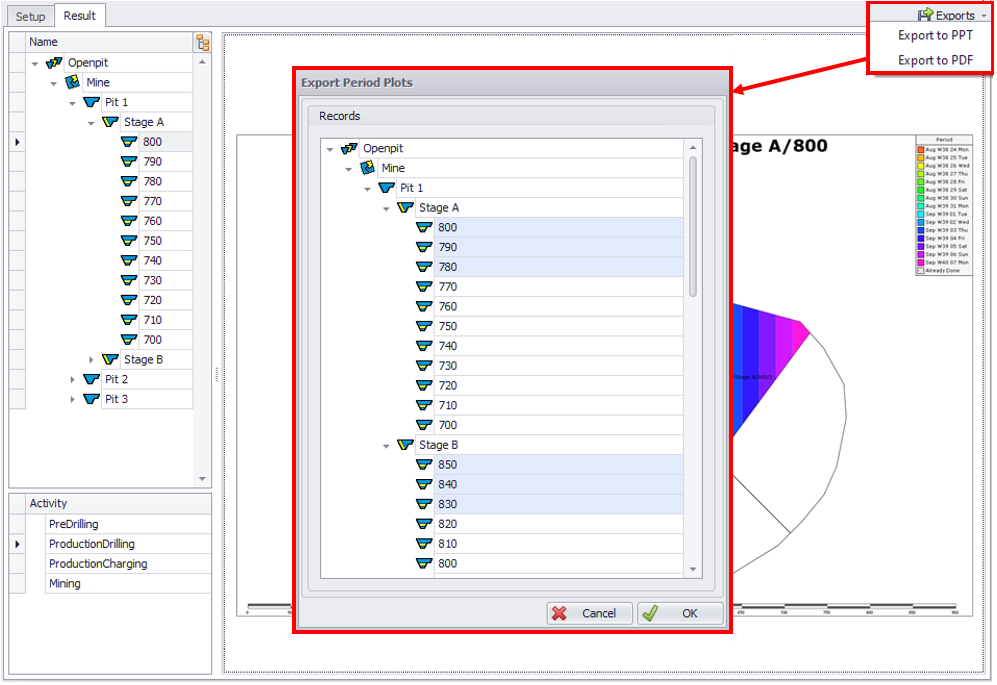
Results tab > Exports option