Groups
In the context of reporting or analysing data, a group is a way to organise and break down information so that you can look at it from different perspectives. Imagine you have a large block model with various measurements or quantities; like grades of material, locations, or types of resources. Instead of viewing everything as a single lump sum, groups allow you to separate this data into meaningful categories.
If you generate the report without any groups defined, the report will contain a single row with the aggregated values of the specified quantities and attributes from the entire, filtered as required, block model.
On the Groups tab, you can specify how these quantities should be broken down into separate categories in the rows and columns of the report, to provide deeper insight into the distribution of material throughout the block model. You can group by rows, columns or both, depending on how you require the report to be presented.
For example, to break down the quantities in a resource model into Measured, Indicated, Inferred and Unclassified, you can define a group based on the Classification field. The aggregated values of the specified quantities and attributes will then be reported separately for each distinct value (i.e. Measured, Indicated, Inferred and Unclassified) in the Classification field. Instead of one overall total, the report will show individual totals for each category, making it easier to see patterns, differences, and specific details. Grouping helps you focus on segments of the data to understand how each part contributes to the whole.
About Group Definitions
A group definition works by setting criteria that organises the data into different categories to provide a more detailed breakdown of the information. Instead of summarising the entire block model as a single aggregated value (e.g. sum or average), the group definition segments the blocks according to characteristics, conditions or ranges that you specify. The criteria is applied to each block in the block model in turn and can consider multiple fields and transformations thereof.
The purpose of the group definition is to specify the criteria that enables the individual categories within the group to be identified and labelled from the block values. Quantities from the block model are aggregated separately for each category.
Each group definition creates a separate set of categories. For example, the group definition for Resource Classification might identify the Measured, Indicated, Inferred and Unclassified categories, whereas the group definition for Stage might identify the First Stage and Final Stage categories.
It is also possible to report within nested groups. For example, to report resource classifications within a series of pits, the first group will be based on the pit to which the block was assigned, and the second group will be based on the classification. Aggregated results will be reported for each resource classification within each pit. Hierarchies of groups can be defined for both the rows and columns of the report.
To view detailed examples of Advanced Block Model Report configuration in a number of scenarios, see Examples.
Row / Column Groups
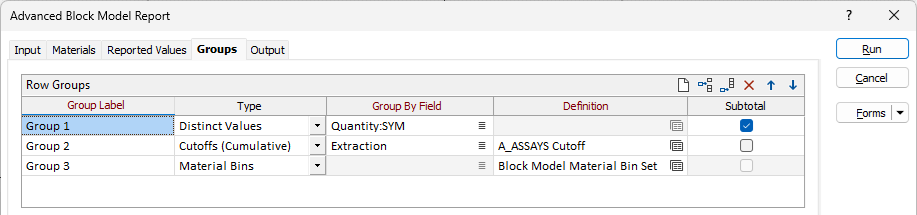
The Row Groups and Column Groups grids contain the same options for the rows and columns of the report groups. Use the options in each grid to specify the following information for the row and column groups to be included in the report:
Group Label
Specify the collective label for the values in the group.
For example, if the values in the group are expected to be Measured, Indicated, Inferred and Unclassified, an appropriate label for the group might be Classification.
Type
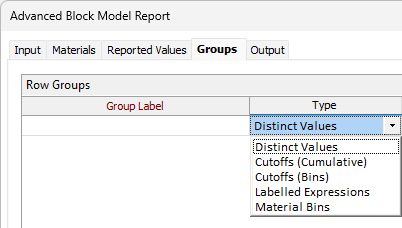
Select the Type of group for which the values are to be identified. The following types of groups can be defined:
-
Cut-offs) - Values above a set of cutoffs (thresholds) for the specified field or expression, with generated labels, such as would be required to produce a grade-tonnage curve. Used for tracking how quantities accumulate over set value thresholds.
For example: Au >=1, Au >=1.5, Au >=2, Au >=2.5, Au >=3.
-
Cut-off Bins - Non-overlapping ranges of cutoffs for the specified field or expression with customised labels.
For example: Low Density, Medium Density, High Density.
-
Block Model Field - Group by a specified Block Model field or expression.
-
Wireframe Property - Group by wireframe Name or Type.
-
Calculated Field - Distinct values from the specified field or expression.
For example: Measured, Indicated, Inferred.
-
Labelled Expressions - Custom ad hoc groups for which membership criteria are specified, with labels.
For example: Inner Pit, Intermediate Stage, Outer Region.
-
Material Bins - Material bins from a Micromine Origin & Beyond material bin set, with names.
For example: Low-Grade Ore, High-Grade Ore.
Group by Field
For the Cut-offs, Cut-off Bins, Block Model Field, Wireframe Property and Calculated Field types, the Group By Field value is required.
Select, or specify, the field or expression from which the values are to be grouped. The value from this field or expression will be used in conjunction with the applicable Definition to identify the group into which the quantities from the current row will be aggregated. Within the group types that require this, the groups are differentiated by the values from the field or expression.
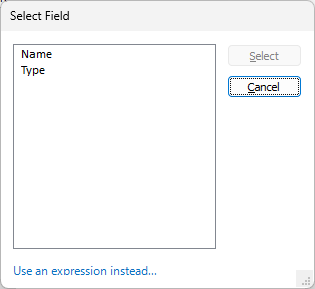
Click the list button to select the field:
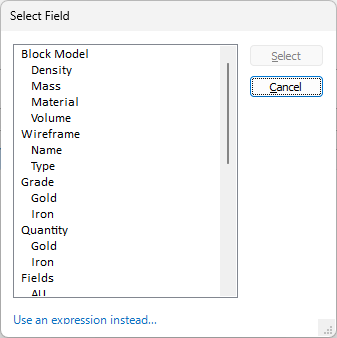
The fields are classified into the following categories:
| Field Category | Description |
|---|---|
| Block Model | Names, properties and quantities of material in the block model, as defined on the Materials tab. |
| Wireframe | Types and names of wireframe solids specified in Materials > Multiple Materials. |
| Grade | Grades for attributes specified in Reported Values > Attributes. |
| Quantity | Quantities for attributes specified in Reported Values > Attributes. |
| Fields | Fields in the block model. |
Dynamic expressions are supported. If you would like to use an expression based on combinations and transformations of the available fields, click Use and expression instead... to open the Expression Editor.
Definition
For Cut-offs, Cut-off Bins, Labelled Expressions and Material Bins, a Definition is required.
Cut-Offs
For the Cut-offs type, you can select cut-off sets that have been defined for use with other estimation and reporting options in Micromine Origin & Beyond. The value from Group By Field must be numeric. When you select a cut-off set and right click to Edit (or press F4), the Cutoff Set form is displayed:
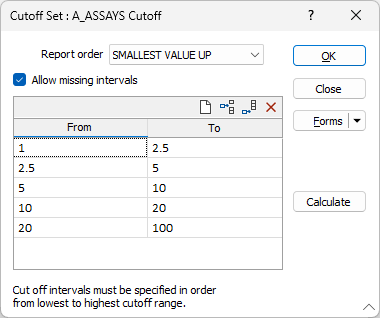
In the Cutoff Set form, select the Report order from the drop down to determine whether the intervals should be reported by Smallest Value Up or Largest Value Down.
If you select the Allow missing intervals check box, the cutoff set will include missing intervals.
In the grid provided, you can define the Cutoff Intervals for the set.
Note: For the Cutoff Intervals, Value refers to the numeric value from the field or expression specified for Group By Field.
Enter a From value to specify the lowest value to be included in the interval. Similarly, enter a To value to specify the highest value to be included in the interval.
Note: Selecting Allow missing intervals enables the To values to be changed as required; otherwise, they are pre-filled with the preceding From value to ensure that the complete range from the lowest From value to the highest To value is spanned by the set of cutoff intervals. Elsewhere in Micromine Origin & Beyond, this defines a set of cutoff intervals of the form From <= value < To.
However, for this report, a set of thresholds {t1, t2, t3 …} is prepared by ranking all of the From and To values in ascending order. Groups are then formed as follows:
-
Value >= t1
-
Value >= t2
-
Value >= t3
-
...
Corresponding labels will be constructed automatically based on the source of the value and the threshold.
Cut-off Bins
If you have selected grouping by Cut-off Bins, define a set of consecutive labelled cut-off bins, which can be used to segment the data across a range of values. The value from Group By Field must be numeric. When you select a cut-off set and right click to Edit (or press F4), the Cutoff Bins form is displayed:
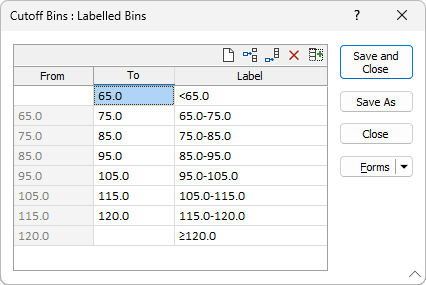
In the Cutoff Bins form, you can enter information for the cutoff bins amongst which the data is to be distributed.
Note: For the Cutoff Bins, Value refers to the numeric value from the field or expression specified for Group By Field.
For the first row only, specify the lowest value to be included in the cutoff bin in the From field. For subsequent rows, this will default to the To value from the previous row.
In the To field, specify the highest value to be included in the cutoff bin. If not specified, all values greater than or equal to From will be included in the cutoff bin.
In the Label field, specify the label for the cutoff bin. The aggregated quantities for the values in the range From <= value < To will be reported against this label.
Distinct Values Equivalent
Specifying a definition for a Cutoff (Bins) group is equivalent to specifying the following expression for a Distinct Values group:
if ([field] >= from1) & ([field] < to1) then“label1”elif ([field] < to2) then“label2”…elif ([field] < toN) then“labelN”endif
Block Model Field
If the selected type is Block Model Field, quantities are created and aggregated into a separate group for each distinct value from the selected Group By Field. Use the list button to select the Group By Field:
Wireframe Property
If the selected type is Wireframe Property, quantities are created and aggregated into a separate group for each distinct value from the selected wireframe property in the Group By Field. Use the list button to select the Group By Field:
Calculated Field
If the selected type is Calculated Field, quantities are created and aggregated into a separate group for each distinct value from Group By Field.
Labelled Expressions
For grouping by Labelled Expressions , you can define ad hoc groups using expressions.
Unlike the group types that require Group By Field, labelled expression groups are not required to be differentiated by the values from a single field or expression.
When you select a Definition form set and right-click to Edit (or press F4), the Labelled Expressions form is displayed:
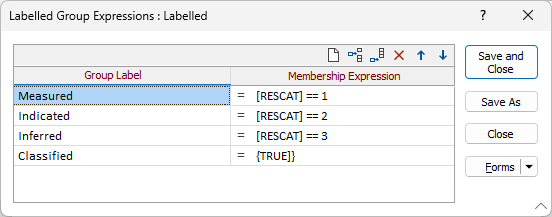
In the Labelled Expressions form, you can specify information for each group. The quantities from each row in the block model will be aggregated into the first group for which the values in the row satisfy, i.e. return {TRUE} from, the membership expression.
The Group Label field is used to enter the label against which the aggregated quantities for the group are to be reported.
In the Member Expressions field, specify the expression from which the result indicates whether values from the current row are to be included in the group. To enter an expression click the button to open the Expression Editor. The expression must return {TRUE} or {FALSE} to indicate whether values from the current row are to be included in the group.
Calculated Field Equivalent
Specifying a definition for a Labelled Expressions group is equivalent to specifying the following expression for a Calculated Field group:
if (membershipExpression1) then“groupLabel1”elif (membershipExpression2) then“groupLabel2”…elif (membershipExpressionN) then“groupLabelN”endif
Material Bins
For a Material Bins grouping, you can specify material bin sets that have been defined for use with other options in Micromine Origin & Beyond.
When you select a form set for the Material Bin Definition and right-click to Edit (or Press F4), the Material Hierarchy diagram is displayed:
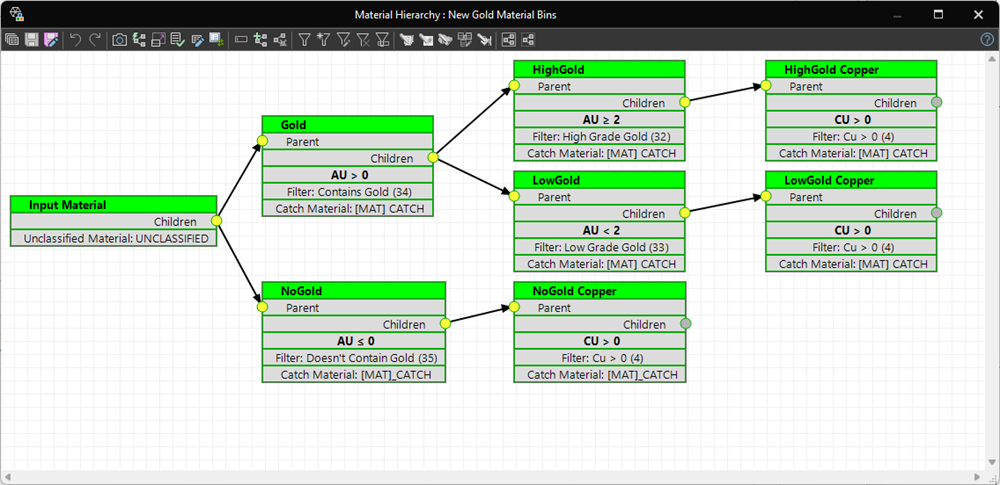
The lowest leaves on each branch of the material hierarchy tree define the groups. Using the diagram above as an example, quantities will be aggregated into the HighGold Copper, LowGold Copper and NoGold Copper groups.
For Row Groups, the Subtotal check box, when selected, indicates that the subtotal rows should be included for each row group of the specified type.
The Swap Row and Column Groups button allows you to interchange the definitions for the row groups and column groups. This will transpose the report.
The Report groups with no material option, when selected, will report all defined grade ranges, even if no blocks fall within a given range. These rows will display 0 values or be left blank as appropriate.
If you select the Report ungrouped material check box, material that does not fall into any of the defined groups will be aggregated and reported separately. If the option is not selected, the quantities for such material will not be included in the report.
With the Report grand total check box selected, the aggregated ungrouped values for the specified quantities and attributes will be included on the last row of the report.
