Chart | PCA
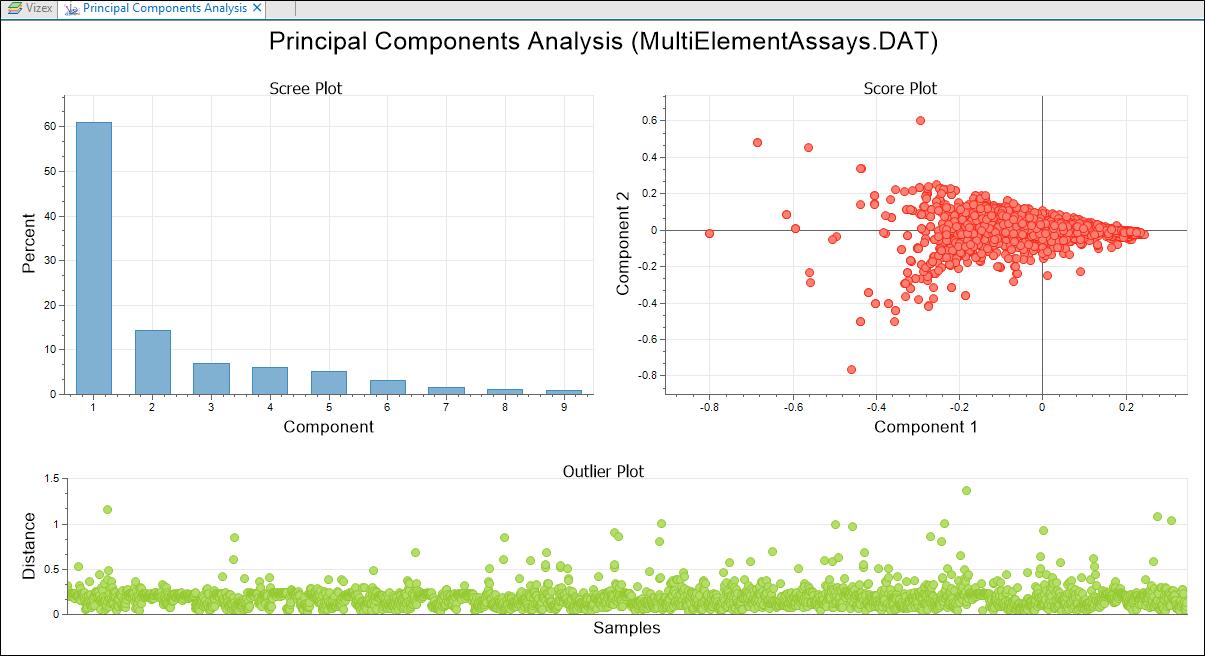
The Chart | PCA window comprises two parts: the Graph and the Properties window. The Graph will depend on the type of plot chosen on the Plots tab of the form. In this example, a Scree Plot, a PCA > Score Plot, and an Outlier Plot have been selected for inclusion:
Load a Chart Form Set
To display an existing form set in a new chart:
- Click the Forms button at right of the form and choose the form set.
- Click OK to apply the settings to the new chart.
Errors at this point will typically refer to a new chart feature with no equivalent in the old graph. To assist you, the application will highlight the offending form response once you read and dismiss the error message.
When you generate a chart, many of the tools and options on the Chart ribbon are common to most charts. See: Chart Tools