PCA
![]()
Principal Components Analysis reduces the dimensionality of multivariate data by looking for correlation amongst the input variables; two strongly correlated variables can easily be simplified to a single variable with minimal lost of information. When this takes place in a large multivariate data set, the overall dimensionality can be significantly reduced.
Input/Output
Select a multivariate data set. The transformed values are written to the input file using the field naming convention "PCA#".
Double-click (or click on the Select icon) to select the name of the file. You can also click the Pick from Vizex button to collapse the form and interactively select a layer containing the file to be inserted and return to the form.
If required, define a Filter to restrict the process to a subset of the records in the file.
Keep in mind that the larger the data set, the longer the analysis will take to run.
Element Fields
Choose the individual variables to be analysed. The maximum number of components extracted will equals the number of element variables. Eigenvectors are the variances of the principal components, and these are used to calculate principal component scores. The coefficients indicate the relative weight of each variable in the component.
Label
Optionally, specify a label for each variable in the list. If a label is blank, then that field’s name will be used as the label.
Scale
Select a LINEAR or NATURAL LOG scale for the Y axis.
Numeric Exceptions
(Optionally) Use the Numeric Exceptions group to control the way that non-numeric values are handled. Non-numeric values include characters, blanks, and values preceded by a less than sign (<).
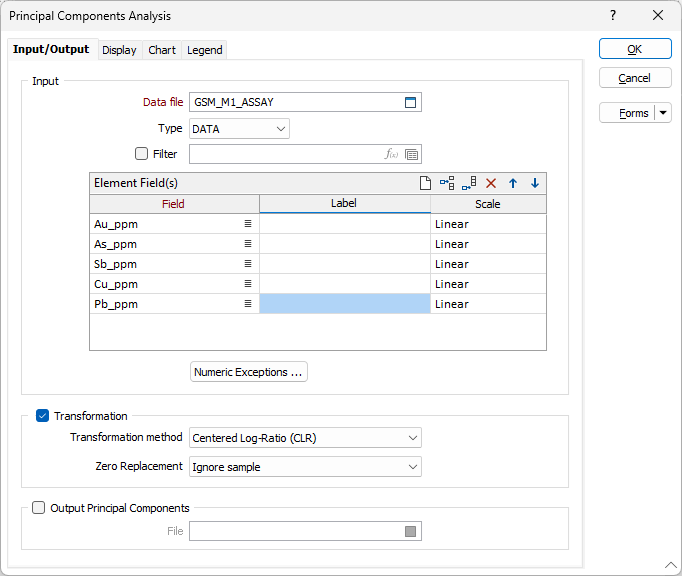
Transformation
Select the check box to enable the transformation method options.
Transformation method
Choose a transformation method:
|
Method |
Description |
|---|---|
| Z-Score | Data is transformed by subtracting the mean value for each field from the values in the compositional data and then dividing by the standard deviation of each field, resulting in data with a mean of zero and a standard deviation of one. |
| Centred Log-Ratio (CLR) | A centred log-ratio transformation is undertaken to remove the effects of closure in the compositional data. |
Zero Replacement
If you selected Centred Log-Ratio as the Transformation method, choose how zero values will be handled:
-
Ignore sample
-
Treated as half of minimum positive values
Output Principal Components
Select this option to write the principal components and the variables they are based on to an output file. The Percent and the Percent Cumulative contribution of each component are also written to the file.
File
Double-click, or click on the Select icon to select, the file to which the principal components and their variables will be written.
![]()